Figures & data
Figure 1. Systems and elements of a Guided Transport system (GTS) (adapted from PD R009-003).
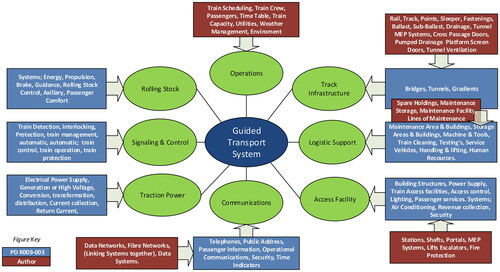
Figure 2. System Engineering Life Cycle stages – BS EN 50126-1 – Author.
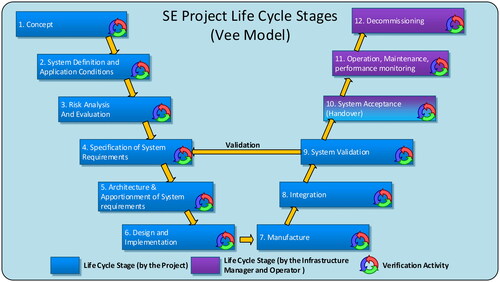
Figure 3. Main Overview process, sections and research questions.
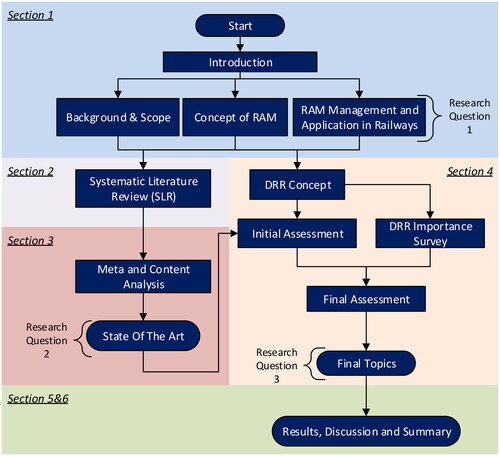
Figure 4. Concept mapping – RAM – (Author).
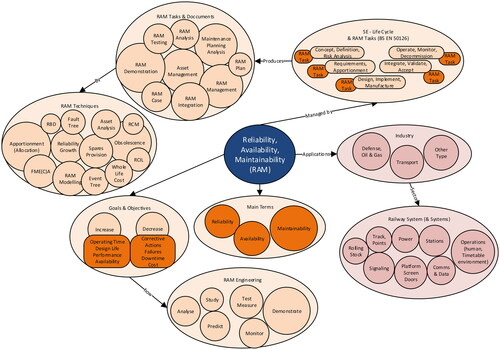
Figure 5. Concept of RAM, goals and objectives (Author).
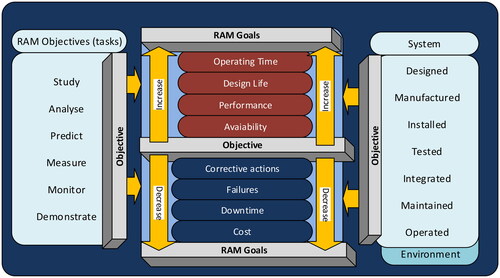
Figure 6. System and RAM Life Cycle and RAM concept.
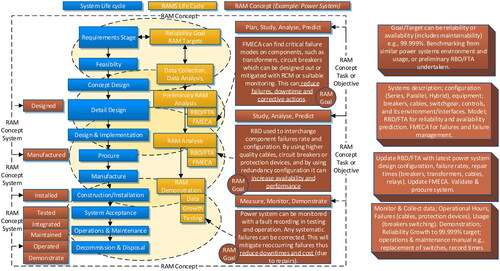
Figure 7. SE Life Cycle stages with RAM related tasks and activities (BS EN 50126-1).
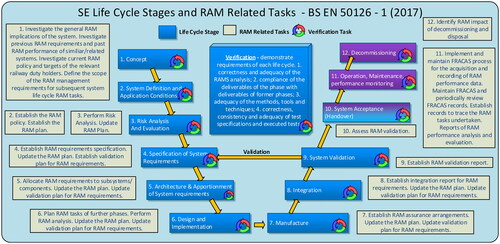
Figure 8. List of RAM techniques (BS EN 50126-1 – Appendix A4, Author).
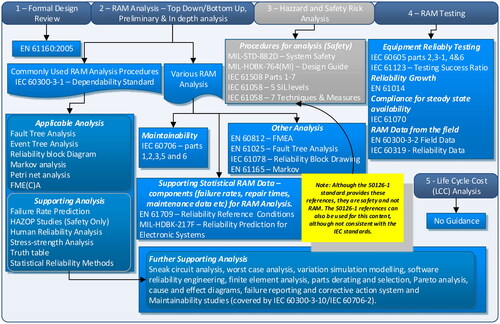
Figure 9. TRAIL Simulator (Author).
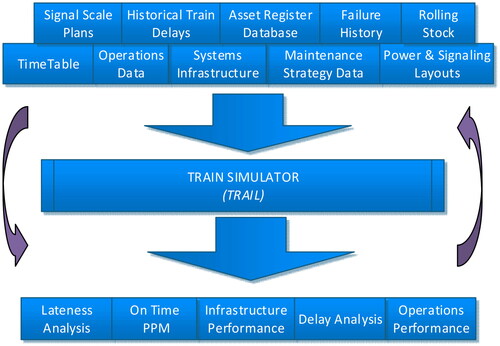
Figure 10. Example TRAIL output (early outputs from CRL project).
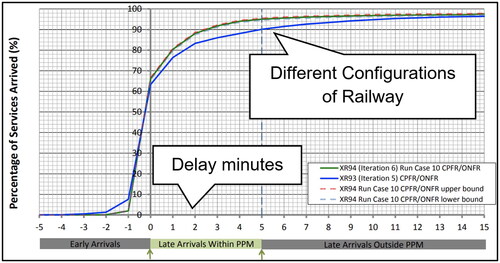
Figure 11. Reliability levels and apportionment (Author).
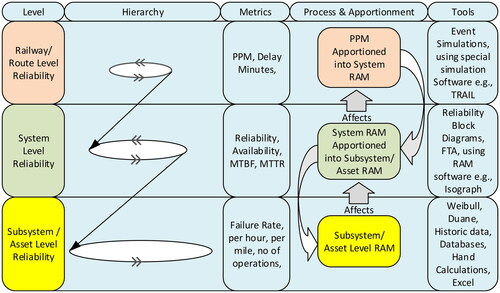
Figure 12. Literature review search process and filtering.
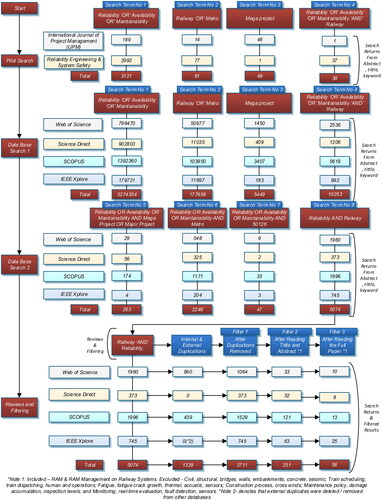
Table 1. Search terms.
Table 2. Search term reviews.
Figure 13. Categories and subcategories for meta and content analysis (Author).
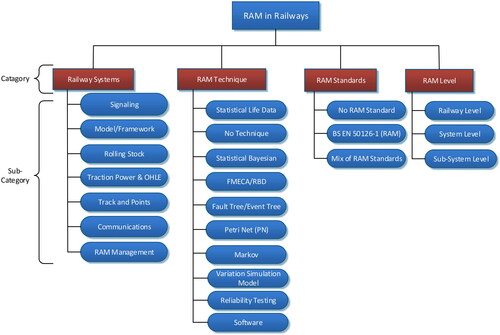
Figure 14. Illustrations of railway systems (Author).
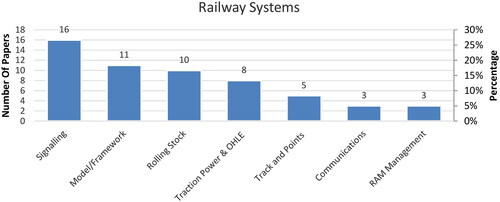
Figure 15. RAM Techniques and railway systems (Author).
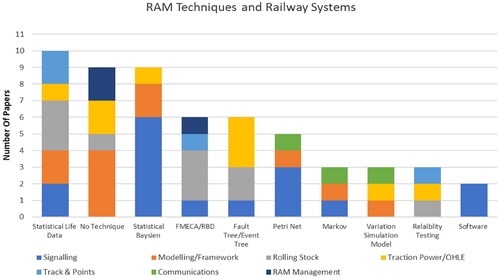
Figure 16. RAM Standards and reliability level (Author).
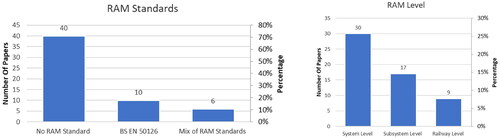
Figure 17. Railway level Horizontal viewpoint – subcategories.
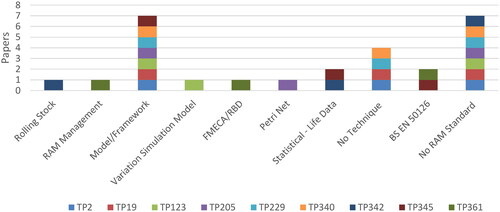
Figure 18. System level Horizontal viewpoint – subcategories.
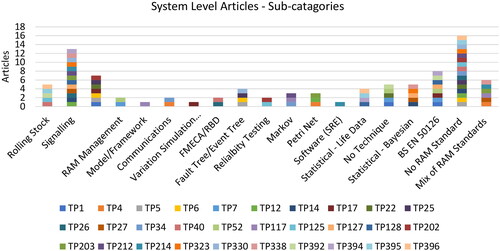
Figure 19. Subsystem level Horizontal viewpoint – subcategories.
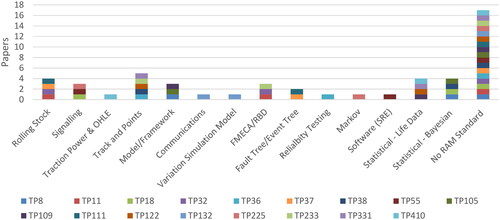
Figure 20. DRR Concept and assessment process.
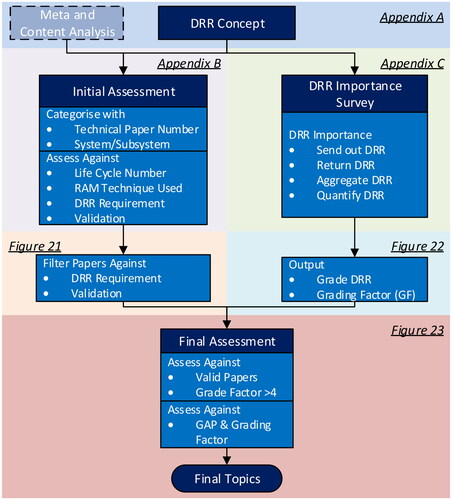
Figure 21. Validated DRR.
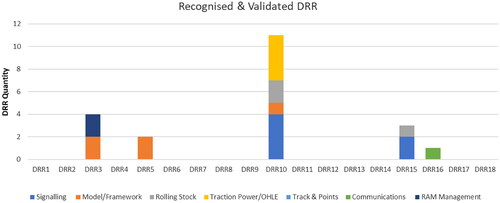
Figure 22. Survey of grading factor level including target level (Author).
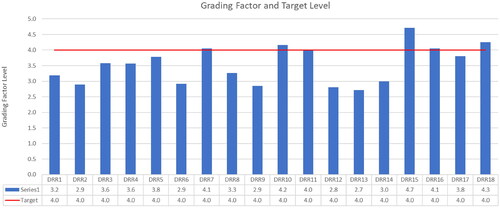
Figure 23. Final assessment.
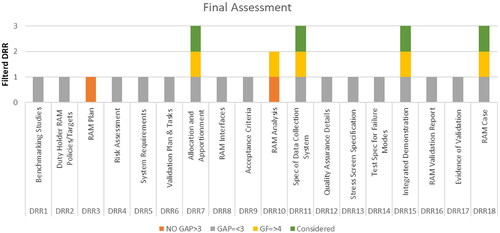
Table 3. State-of-the-art summary.
Figure 24. Final output from the study (Author).