Figures & data
Table 1. Composition of diets.
Table 2. Antibodies for western blotting.
Table 3. Rt-qPCR primers sequences.
Figure 1. Phenotypical, histological and biochemical evidences of NAFLD phenotype in offspring at 6 months: (A) body weight, (B) liver weight, (C) H&E stains of representative liver sections, (D) NAFLD activity score, (E) plasma ALT concentrations and (F) hepatic triglyceride content. n = 5 per experimental group; values shown as mean ± SEM; OffCon-SC: offspring of lean weaned onto standard chow diet; OffCon-OD: offspring of lean weaned onto obesogenic diet; OffOb-SC: offspring of obese weaned onto standard chow diet; OffOb-OD: offspring of obese weaned onto obesogenic diet; one way ANOVA with Tukey’s post-hoc test for the main comparisons (OffCon-SC versus OffCon-OD; OffCon-SC versus OffOb-OD; OffCon-OD versus OffOb-OD).
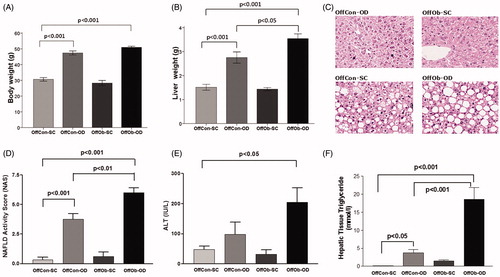
Figure 2. Protein and mRNA concentration of UPR pathways in normal physiological condition (OffCon-SC experimental group; offspring of lean weaned onto standard chow diet) during 24 h. n = 3–4 per experimental time.
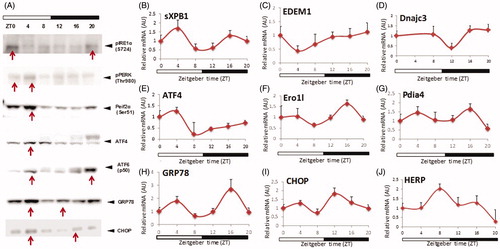
Figure 3. Protein and mRNA hepatic concentrations of UPR pathways depending on maternal feeding and offspring post-weaning diet during 24 h. n = 3–4 per experimental group/time point; values shown as mean ± SEM; OffCon-SC: offspring of lean weaned onto standard chow diet; OffCon-OD: offspring of lean weaned onto obesogenic diet; OffOb-OD: offspring of obese weaned onto obesogenic diet; *statistical differences (p < .05) between OffCon-SC and OffCon-Ob. #Statistical differences (p < .05) between OffCon-SC and OffOb-Ob.
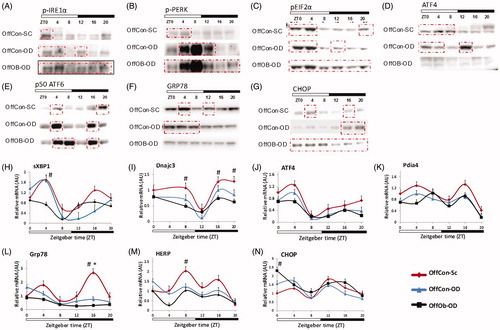
Figure 4. Inflammation, apoptosis and autophagy assessment by (A) TUNEL staining assay, (B) active caspase-3 staining and (C) phospho-JNK protein concentration measurement. n = 5 per experimental group; values shown as mean ± SEM; OffCon-SC: offspring of lean weaned onto standard chow diet; OffCon-OD: offspring of lean weaned onto obesogenic diet; OffOb-SC: offspring of obese weaned onto standard chow diet; OffOb-OD: offspring of obese weaned onto obesogenic diet; one way ANOVA with Tukey’s post-hoc test for the main comparisons (OffCon-SC versus OffCon-OD; OffCon-SC versus OffOb-OD; OffCon-OD versus OffOb-OD).
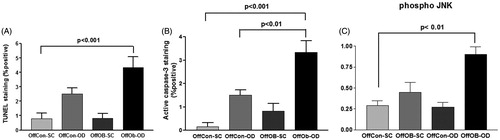
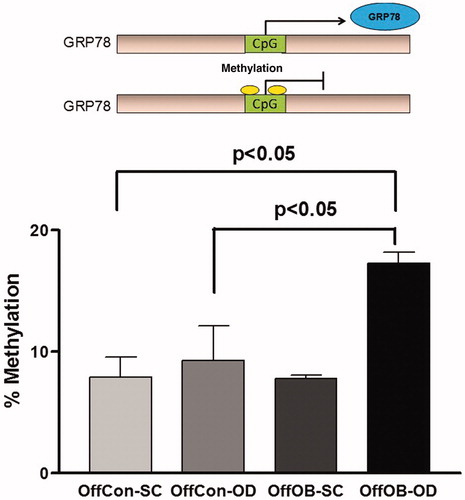
Figure 5. Specific DNA methylation measurement in GRP78 promoter region. n = 5 per experimental group; values shown as mean ± SEM; OffCon-SC: offspring of lean weaned onto standard chow diet; OffCon-OD: offspring of lean weaned onto obesogenic diet; OffOb-SC: offspring of obese weaned onto standard chow diet; OffOb-OD: offspring of obese weaned onto obesogenic diet; one way ANOVA with Tukey’s post-hoc test for the main comparisons (OffCon-SC versus OffCon-OD; OffCon-SC versus OffOb-OD; OffCon-OD versus OffOb-OD).