
Figures & data
Figure 1. Study flowchart. KB290, Lactobacillus brevis KB290; βC, β-carotene.
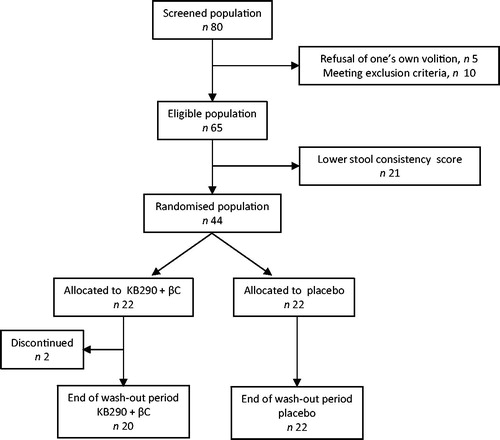
Figure 2. Correlation between the intensity of abdominal pain and stool consistency or stool frequency at baseline. The score of abdominal pain intensity and stool consistency (A) or abdominal pain intensity and stool frequency (B) of all subjects each day at baseline week was plotted. Spearman’s correlation coefficients were calculated. Black circles denote individual data. Darkness of circles shows overlapping of data. Solid lines indicate collinear approximation. n = 271.
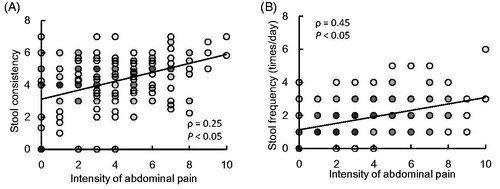
Table 1. Baseline characteristics of participants.
Figure 3. Effects of KB290 + βC on primary endpoints. Changes in stool consistency score (A) and abdominal pain intensity score (B) are shown. Black and white circles denote mean values for KB290 + βC and placebo groups, respectively. Bars show SD. Baseline is denoted by a dotted line. KB290 + βC group: n = 20, placebo group: n = 22. §p < .1, *p < .05, unpaired Student’s t-test.
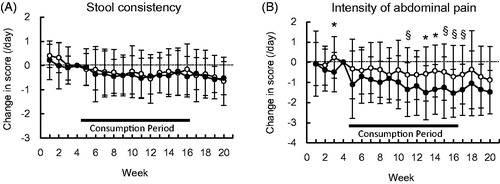
Figure 4. Effects of KB290 + βC on abdominal symptoms in secondary endpoints. Changes in stool frequency (A), urgency (B), abdominal discomfort (C), distension (D), incomplete evacuation (E), straining (F), passage of gas (G), borborygmi (H) and composite score (I) are shown. Black and white circles denote mean values for KB290 + βC and placebo groups, respectively. Bars show SD. Baseline is denoted by a dotted line. KB290 + βC group: n = 20, placebo group: n = 22. §p < .1, *p < .05, unpaired Student’s t-test.
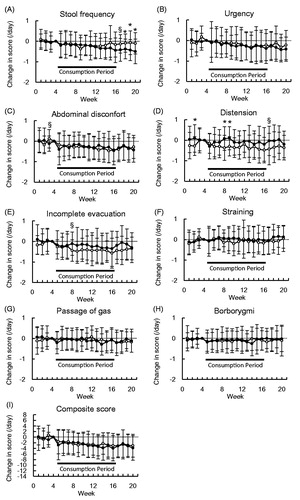
Table 2. Changes in quality of life from baseline.
Figure 5. Effects of KB290 + βC on WPAI. Overall loss in work productivity (A) and activity impairment (B) are shown. Black and white circles denoted mean values for KB290 + βC and placebo groups, respectively. Bars show SD. KB290 + βC group: n = 13–16, placebo group: n = 14–17.
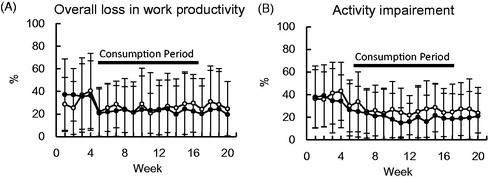
Figure 6. Ad hoc analyses for WPAI. Number of subjects who showed no overall loss in work productivity (A) and activity impairment (B) were analysed in each week. Black and white circles denote mean values for KB290 + βC and placebo groups, respectively. Numbers of subjects in each group are the same as those for Figure 5. Data of (A) and (B) were concluded in each period (C and D, respectively). Black and white bars denote mean values for KB290 + βC and placebo groups, respectively. Error bas denote SD. Run-in period: n = 4, consumption period: n = 12, washout period: n = 4. §p < .1, *p < .05, unpaired Student’s t-test.
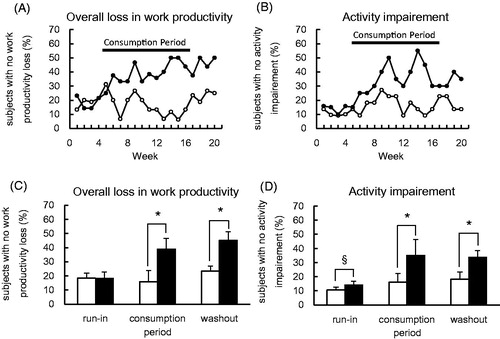
Table 3. Changes in serum concentrations of cytokines from baseline.