Figures & data
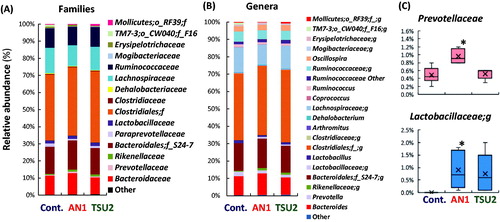
Figure 3. Relative abundance of the family (A), genus (B), and typical bacterial groups (C) in mice administered Lactobacillus plantarum AN1 and Tennozu-SU2 (TSU2) compared with the control group (Cont.). The box plot in (C) shows the values of the third quartile, median, first quartile, and minimum of six mice. *p < 0.05.