Figures & data
Figure 1. HPLC anthocyanin profile and quantification of A. chilensis powder recorded at 520 nm. Peaks are identified as shown in .
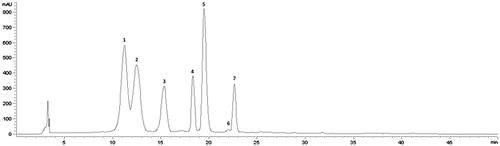
Table 1. Anthocyanins composition of maqui-berry powder.
Figure 2. Temporal course curves (A) and dose-response (AUC) antinociceptive effects of A. chilensis powder (AC) and tramadol (TRA, reference drug) after parenteral administration on the neurogenic (B) and inflammatory (C) phases of the 1% formalin intraplantar in mice compared to the vehicle. A two-way ANOVA followed by Bonferroni’s post-hoc test for temporal course curves and a one-way ANOVA followed by Dunnett’s post-hoc test for dose-response data. *p < 0.05, **p < 0.01 and ***p < 0.001, n = 6 repetitions.
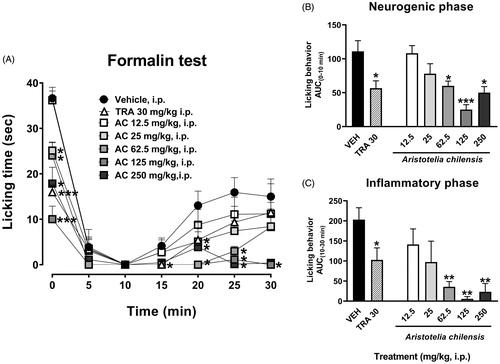
Figure 3. Temporal course curves (A) and dose-response (AUC) antinociceptive effects of A. chilensis freeze-dried (AC) and tramadol (TRA, reference drug) after enteral administration on the neurogenic (B) and inflammatory (C) phases of the 1% formalin intraplantar in mice compared to the vehicle. A two-way ANOVA followed by Bonferroni’s post-hoc test for temporal course curves and a one-way ANOVA followed by Dunnett’s post-hoc test for dose-response data. *p < 0.05, **p < 0.01 and ***p < 0.001, n = 6 repetitions.
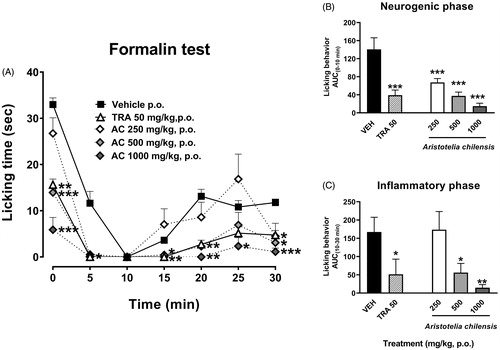
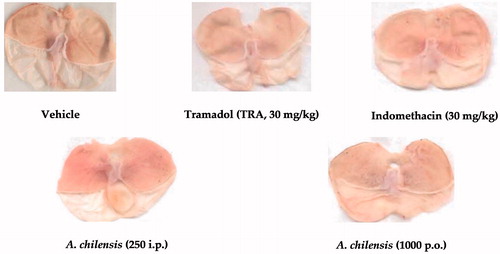
Figure 4. Representative photos of the gastric damage evaluation of dissected stomachs from mice receiving treatment of vehicle, positive anti-inflammatory drug (indomethacin) and the highest dosage of A. chilensis using parenteral (250 mg/kg, i.p.) or. enteral (1000 mg/kg, p.o.) route of administration and after the formalin test in mice.