
Figures & data
Table 1. Baseline data for the analysed population (n = 28).
Figure 1. Overview of the study schedule.
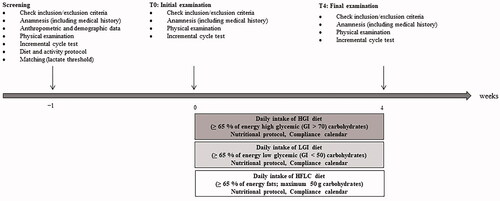
Figure 2. Flow chart of subject recruitment, randomisation, and follow up.
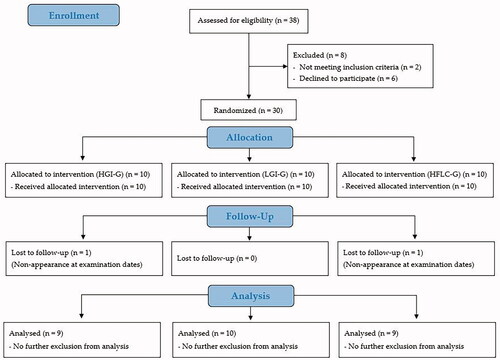
Figure 3. Changes in efficacy outcomes. (A) Power at LT; (B) power at IAT; (C) VO2 peak; (D) absolute power output; (E) relative power output. LT: lactate threshold; IAT: individual anaerobic threshold. Data shown as mean ± SD. ap < 0.05 between HGI-G and HFLC-G; bp < 0.05 between LGI-G and HFLC-G in the post-hoc analysis.
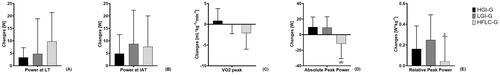
Table 2. Performance-related outcomes of the incremental cycle test at baseline and following the nutritional concepts.
Data availability statement
The datasets generated for this study are available on request to the corresponding author.