
Figures & data
Figure 1. Cell viability percentages in human fibroblasts Hs68 cells. Data are expressed as mean ± SEM (n = 3). The results are expressed as a percentage relative to the average of the Blank group (100%). *Student’s t-test, p < 0.05 vs. blank.
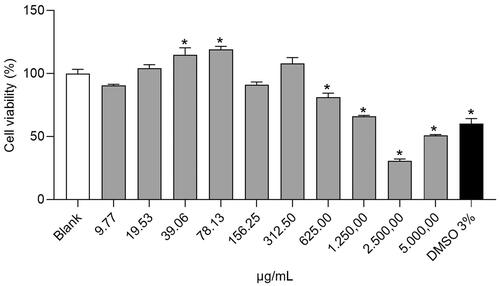
Figure 2. Pro-collagen type I levels in the cell and soluble fractions (A) and percentage of pro-collagen type I in the cell fraction relative to the total quantified (B), total collagen levels in the cell and soluble fractions (C) and percentage of total collagen in the cell fraction (D), hyaluronic acid levels in the cell and soluble fractions (E) and percentage of hyaluronic acid in the cell fraction (F) and MMP-1 levels in the soluble fraction (G) in human fibroblasts Hs68. Data are expressed as mean ± SEM (n = 3). abcMean values represented with different letters are significantly different from each other (One-way ANOVA, Duncan post-hoc, p < 0.05).
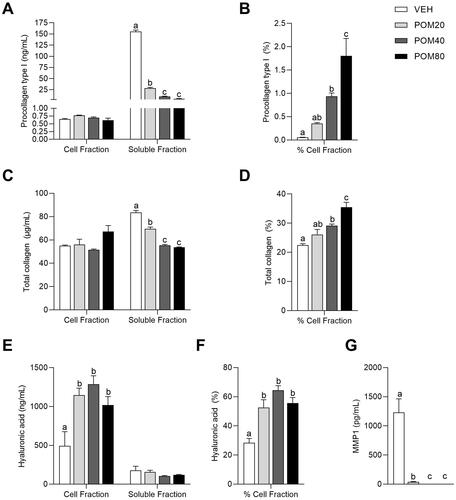
Figure 3. Cell viability percentages (A) and relative ROS levels (B) in human fibroblasts Hs68 cells obtained in the preventive assay. Data are expressed as mean ± SEM (n = 3). The results are expressed as a percentage relative to the average of the VEH-NO UV group (100%). abcMean values represented with different letters are significantly different from each other (One-way ANOVA, Duncan post-hoc, p < 0.05).
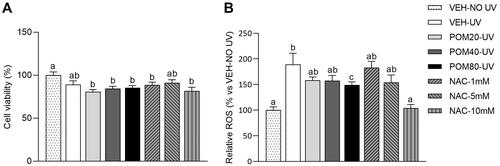
Figure 4. Pro-collagen type I levels in the cell and soluble fractions (A) and percentage of pro-collagen type I in the cell fraction relative to the total quantified (B), total collagen levels in the cell and soluble fractions (C) and percentage of total collagen in the cell fraction (D), hyaluronic acid levels in the cell and soluble fractions (E) and percentage of hyaluronic acid in the cell fraction (F) and MMP-1 levels in the soluble fraction (G) in human fibroblasts Hs68 cells obtained in the preventive assay. Data are expressed as mean ± SEM (n = 3). abcdMean values represented with different letters are significantly different from each other (One-way ANOVA, Duncan post-hoc, p < 0.05).
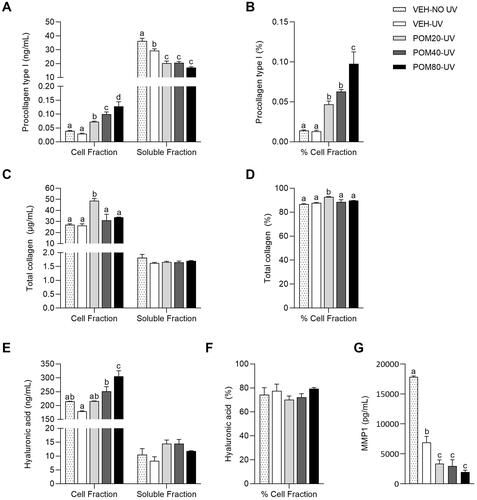
Figure 5. Cell viability percentages (A) and relative ROS levels (B) in human fibroblasts Hs68 cells obtained in the regenerative assay. Data are expressed as mean ± SEM (n = 3). The results are expressed as a percentage relative to the average of the VEH-NO UV group (100%). abcdMean values represented with different letters are significantly different from each other (One-way ANOVA, Duncan post-hoc, p < 0.05).
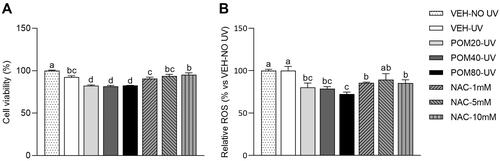
Figure 6. Pro-collagen type I levels in the cell and soluble fractions (A) and percentage of pro-collagen type I in the cell fraction relative to the total quantified (B), total collagen levels in the cell and soluble fractions (C) and percentage of total collagen in the cell fraction (D), hyaluronic acid levels in the cell and soluble fractions (E) and percentage of hyaluronic acid in the cell fraction (F) and MMP-1 levels in the soluble fraction (G) in human fibroblasts Hs68 cells obtained in the regenerative assay. Data are expressed as mean ± SEM (n = 3). abcdMean values represented with different letters are significantly different from each other (One-way ANOVA, Duncan post-hoc, p < 0.05).
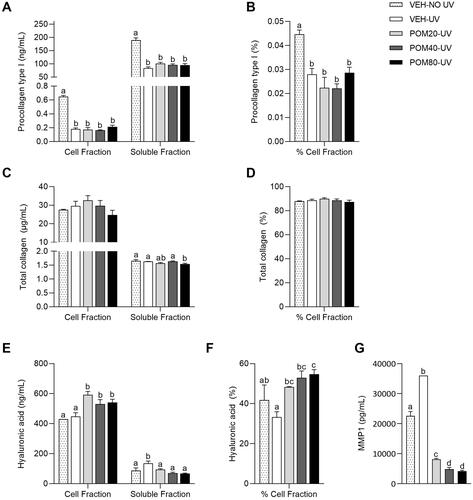
Table 1. Kojic acid and Pomanox® inhibitory percentage of tyrosinase activity and IC50 index.
Data availability statement
The data presented in this study are available on request from the corresponding author.