
Figures & data
Table 1. Commercial orange juices purchased from four European countries, each sample from a different company.
Table 2. Concentration of ascorbic acid, dehydroascorbic acid, and vitamin C (mg/100 mL) in commercial orange juice samples from four different countries.
Table 3. Concentration of ascorbic acid, dehydroascorbic acid, and vitamin C (mg/100 mL) in freshly squeezed orange juice samples at different timepoints (t0, t12, t24 and t48 h).
Figure 1. Box plots for the commercial and freshly squeezed orange juice samples (0, 12, 24 and 48 h). The red cross is the mean value, the Middle line is the median.
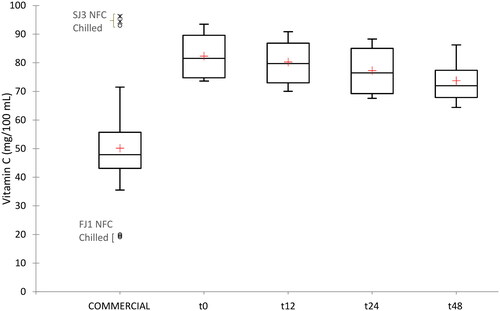
Figure 2. Prediction time of the vitamin C degradation in freshly squeezed orange juice samples. The mean value of commercial samples is highlighted in orange colour.
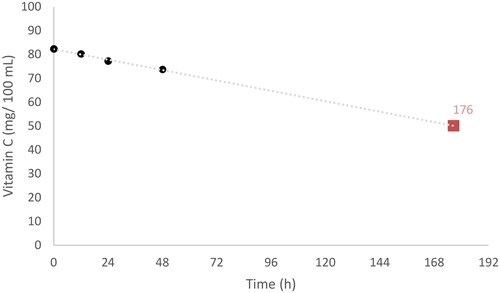
Table 4. Concentration of ascorbic acid, dehydroascorbic acid and total vitamin C (mg/100 mL) in freshly squeezed orange juice samples at different timepoints (t0, t12, t24 and t48 h, mean of all companies) and commercial juices.
Table 5. Content of total and individual flavanones (mg/100 mL) of commercial orange juice samples from four different countries.
Table 6. Content of total and individual flavanones (mg/100 mL) of freshly squeezed orange juice samples at different timepoints (t0, t12, t24 and t48 h).
Table 7. Concentration of total and individual flavanones (mg/100 mL) in freshly squeezed orange juice samples at different timepoints (t0, t12, t24 and t48 h, mean of all companies) and commercial juices.