
Figures & data
Table 1. Sample selection and distribution of observations across years
Table 2. Descriptive statistics
Table 3. Panel regressions for cost of equity capital on overall disclosure
Figure 1. U-shaped relation between cost of equity capital and volume of annual report narratives. This figure illustrates the reduction in the cost of equity capital as a function of the (ranked) volume of annual report narratives, as implied by the regression results in Table , column (4) (that is after allowing for firm fixed effects)
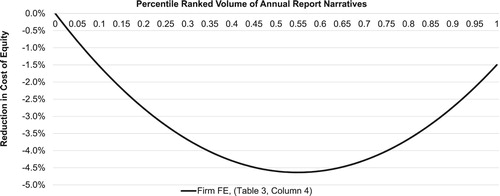
Table 4. Three-year rolling window regressions showing variation over time in optimum levels of disclosure
Table 5. Firm learning effects and disclosure adjustments
Table 6. Regulatory change and clutter
Table 7. Individual component analysis
Supplemental material