
Figures & data
Figure 1. Overview of our microeconomic model for normal and abnormal CSR. This figure presents an overview of our microeconomic model for normal and abnormal CSR and spans from −33 to +59 – the range of KLD CSR data: A firm that has all concerns in all dimensions and no strengths (−33) vs. a firm that has all strengths in all dimensions and no concerns (+59).
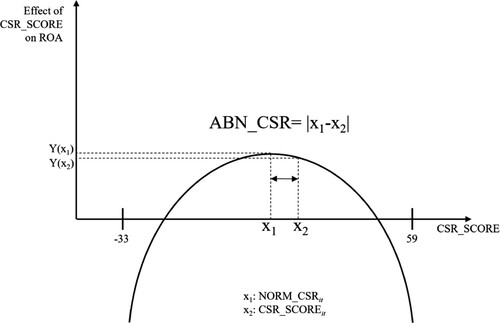
Table 1. Summary of the sample selection procedure.
Table 2. Descriptive statistics of regression variables.
Table 3. Pearson correlation table.
Table 4. Percentage of significant coefficients from the cross-sectional Poisson regressions (per size deciles and fiscal years) on CSR strength (CSR_Strit) and concerns (CSR_Conit).
Table 5. Results for regressing (abnormal) CSR (NORM_CSRit; ABN_CSRit) on financial performance (ADJ_ROAit).
Figure 2. Empirical estimation: Non-linear relationship between abnormal CSR and financial performance. This figure shows the graph of the estimated quadratic function between abnormal CSR (x-axis) and industry-adjusted ROA (y-axis). The underlying mathematical equation based on the coefficients for abnormal CSR is: Y = −0.00000171x – 0.000589x2. The figure includes the full range of KLD CSR data: a firm that has all concerns in all dimensions and no strengths (−33) vs. a firm that has all strengths in all dimensions and no concerns (+59).
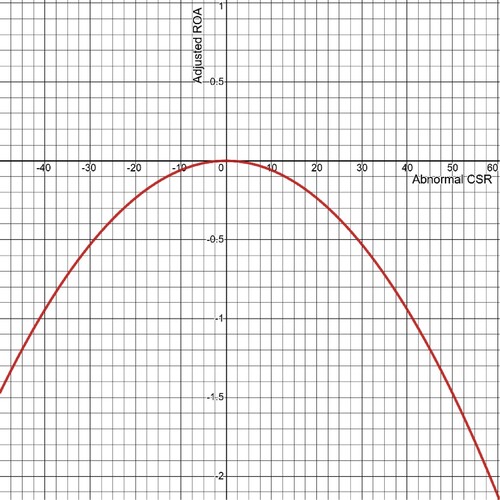
Table 6. 2SLS regression.
Table A1. Variable definitions.
Data Availability Statement
The data that support the findings of this study are available from public sources as described in the manuscript. Restrictions apply to the availability of these data, which were used under license for this study.