
Figures & data
Table 1. Sample construction.
Table 2. Basic trend in female and male auditors’ salaries.
Figure 1. Log salary difference, male – female at each percentile.
Notes: Figure presents three graphs showing the log wage difference between male and female CPAs in the auditing industry. The gap is calculated as male CPAs’ log salary (LN_SALARY) at each percentile of the male CPAs’ salary distribution minus female CPAs’ log salary at the corresponding percentile of the female CPAs’ salary distribution. The figure plots the gap for 2007, 2010, and 2015 separately.
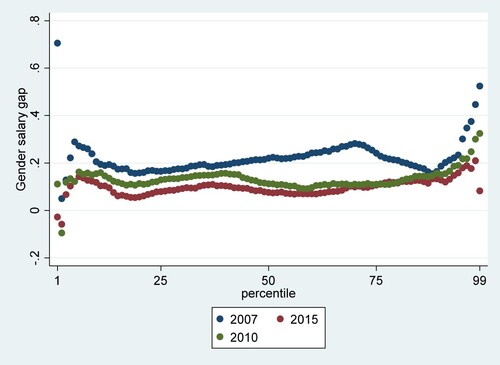
Table 3. Descriptive statistics.
Table 4. Gender salary gap: OLS estimation.
Table 5. Blinder-Oaxaca decomposition of the gender salary gap: 2007, 2011, and 2015
Table 6. Female leadership and auditors’ client portfolio size in the Big Six.