
Figures & data
Figure 1. Disaster risk (DR) across counties in continental USA.
Note: Figure presents a map chart of average disaster risk (DR) across counties in continental USA.
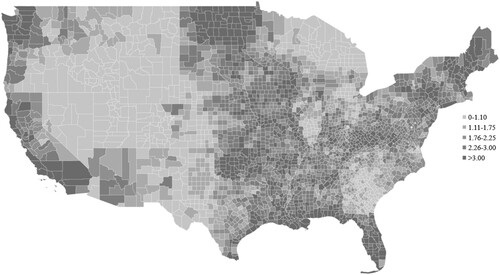
Table 1. Validation of disaster risk measure through the UN Sendai framework for disaster risk reduction.
Table 2. Descriptive statistics.
Table 3. Relation between disaster risk and loan loss provisions.
Figure 2 Counties affected by hurricanes and hurricane Katrina during the third quarter of 2005.
Note: Figure presents a map chart of counties affected by hurricane Katrina (colored in light gray, 179 counties, 21,655 bank-quarter observations), counties not affected by hurricane Katrina without hurricane events in the FEMA dataset during the 10 years prior to Hurricane Katrina (colored in black, 2367 counties, 355,414 bank-quarter observations), and counties not affected by hurricane Katrina with at least 1 hurricane event in the FEMA dataset during the 10 years prior to Hurricane Katrina (colored in dark gray, 689 counties, 68,855 bank-quarter observations).
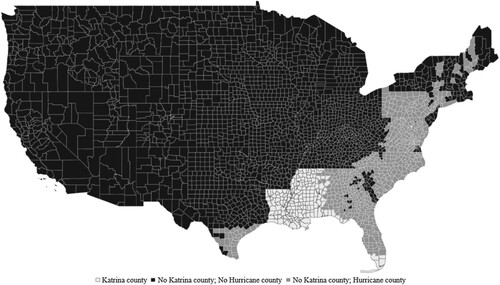
Table 4. Relation between disaster risk and loan loss provisions: difference-in-differences approach.
Table 5. Relation between additional measures of disaster risk and loan loss provisions.
Table 6. Relation between disaster risk and loan loss provisions: cross-sectional tests based on banks’ characterisctis.
Table 7. Relation between disaster risk, current loan loss provisions and risk management.
Online_Appendix_29082022_final.docx
Download MS Word (98.5 KB)Data Availability Statement
The data are available from the sources identified in the text.