Figures & data
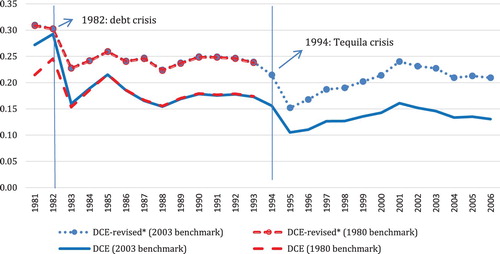
Figure 2. The domestic content of aggregate maquila exports (DCE).
Notes: Domestic content as a share in aggregate maquila exports. Authors’ calculations using time series estimates and equation (1*). DCE (2003 benchmark) and DCE (1980 benchmark) are in the original published article.