Figures & data
Table 1. Key professional services available in Australian community pharmacies (The Citation6CPA, Citation2015).
Table 2. Intervention steps.
Table 3. Consumer participant characteristics.
Table 4. Time spent working through steps of the medication support service.
Table 5. Outcomes measured at baseline (T1) and at the completion of each intervention (T2).
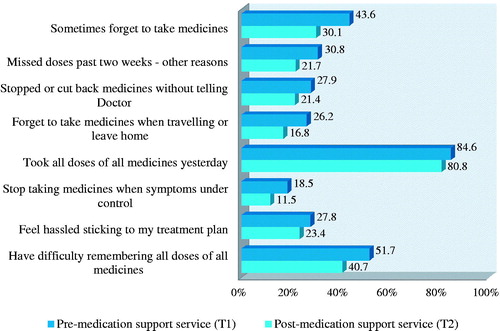
Figure 1. Morisky Medication Adherence Scale (MMAS-8)© (Krousel-Wood et al., Citation2009; Morisky et al., Citation2008; Morisky & DiMatteo, Citation2011). Use of the ©MMAS is protected by US copyright laws. Permission for use is required. A license agreement is available from: Donald E. Morisky, ScD, ScM, MSPH, Professor, Department of Community Health Sciences, UCLA School of Public Health, 650 Charles E. Young Drive South, Los Angeles, CA 90095-1772, [email protected].