Figures & data
Table 1. Three “clusters” of participants in the consultative exercise, including PPI participants.
Figure 1. PRIMSA flow diagram (Moher, Liberati, Tetzlaff, & Altman,Citation2009).
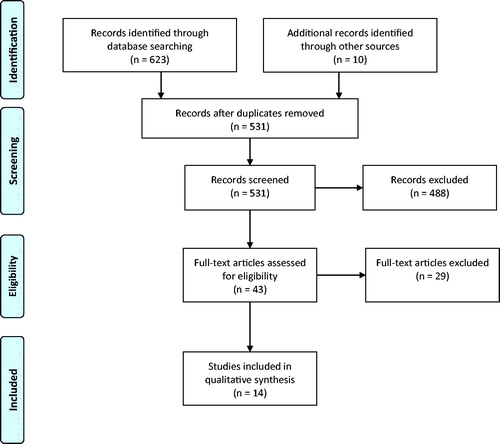
Table 2. Included studies’ characteristics and main findings.
Table 3. TIDIieR checklist of interventional components (Hoffmann et al.,Citation2014).
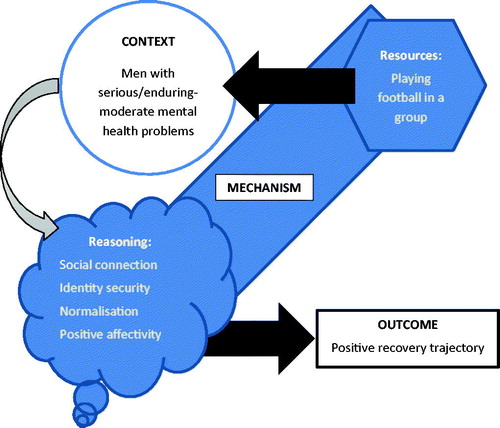
Figure 2. CMOc for football for mental health intervention.