
Figures & data
Table 1. Demographic and clinical characteristics of sample in Study 1 (N = 240).
Table 2. Existential domains, constituting components, and illustrative excerpts from the data.
Table 3. Demographic information relating to the sample for Study 2 (N = 178).
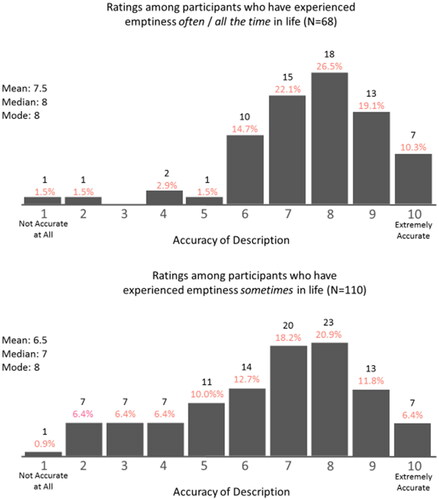
. Distribution of ratings about the accuracy of description of the proposed definition of “emptiness.”
Supplemental material