
Figures & data
Figure 1. Flow chart of the search strategy and results.
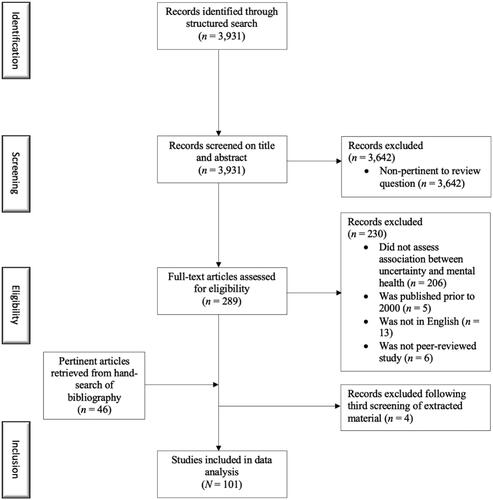
Table 1. Descriptive information on studies.
Figure 2. Geographical map visualizing the number of studies conducted in each country according to colour (i.e., darker colour = more studies conducted in that country).
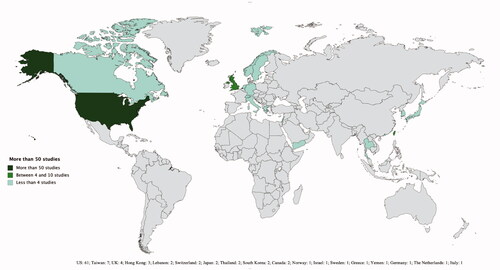
Table 2. Mental health and psychosocial outcomes investigated across studies.