
Figures & data
Figure 1. A PRISMA 2020 flow diagram for the review’s study identification, screening, and inclusion process.
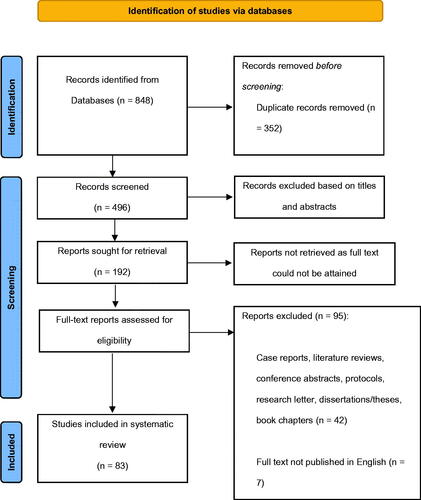
Table 1. List of studies with AF personnel as the study population that was included in the final synthesis (n = 53).
Table 2. List of studies with military veteran participants as the study population that were included in the final synthesis (n = 30).