
Figures & data
Table 1. Visual characteristics per group.
Table 2. Participants’ characteristics.
Figure 1. Mobility Scooter (above) and finger-operated throttle (below).
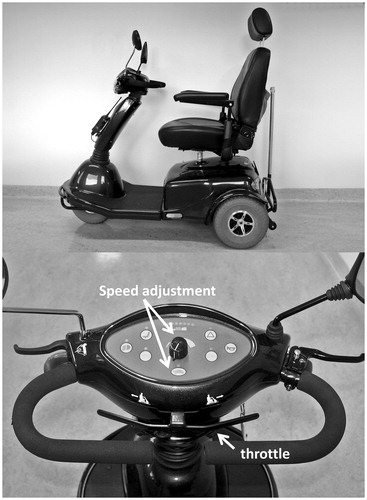
Table 3. Descriptive statistics and comparisons between controls and visually impaired on overall performance on the driving skill test.
Figure 2. Percentages of participants per group who needed repetitions.
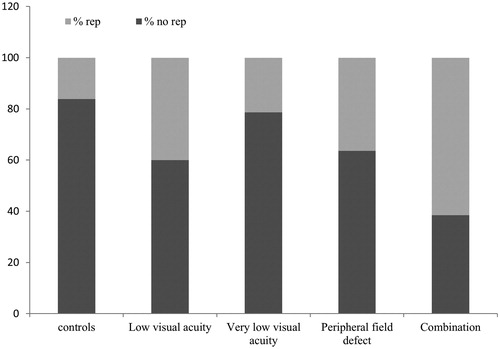
Table 4. Comparison per group how often repetition was needed or not.
Table 5. Number of repetitions per element of the mobility scooter driving skill test.
Supplemental material