
Figures & data
Table 1. Respondents’ demographic characteristics (n = 1217).
Figure 1. The respondents’ use of various clinical tests. The blue vertical pillars present “always, very often, and often” in percentage of use (0–100%).
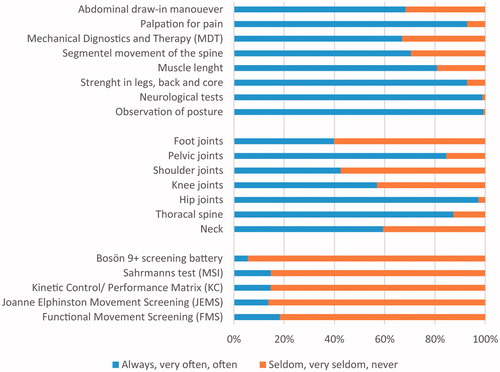
Figure 2. Respondents’ use of PROMs included in the survey. The blue vertical pillars present “always, very often, and often” in percentage of use (0–100%).
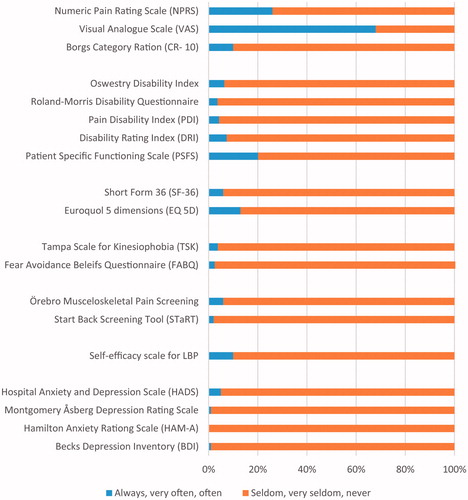
Table 2. Advantages using PROMs (response rate n = 529).
Table 3. Categories and sub categories of regarding barriers of using PROMs (response rate n = 824).
Supplemental material