
Figures & data
Table 1. Demographic characteristics in patients with severe-to-profound hearing loss in Sweden with the proportions of male and female patients, crude odds ratios (OR) with 95% confidence intervals (CI) comparing gender differences.
Figure 1. The median air-conduction hearing thresholds for a total of 4286 male (n = 2157) and female (n = 2129) patients in the quality registry for severe-to-profound hearing impairment on the right ear and left ear separately.
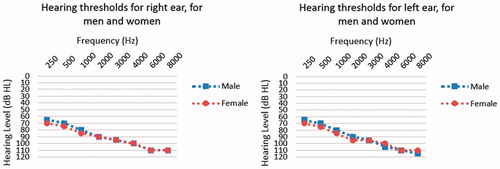
Table 2. The proportion of patients with severe-to-profound hearing loss in audiological rehabilitation with various hearing care professionals in Sweden with the proportions of male and female patients, crude odds ratios (OR) with 95% confidence intervals (CI) comparing gender differences.
Table 3. The benefit of various audiological rehabilitation efforts for patients who participated/not participated for group rehabilitation and/or visits to the multiple professional competencies, calculated with “None/Some” benefits, for patients with severe-to-profound hearing impairment in Sweden, logistic regression analyses with crude and adjusted odds ratios (OR) with 95% confidence intervals (CI). For logistic regression Hosmer and Lemeshow Test shows goodness-of-fit 0.315.
Table 4. The proportion of patients for different QoL outcomes, in patients with severe-to-profound hearing loss in Sweden with the proportions of male and female patients, Crude odds ratios (OR) with 95% confidence intervals (CI) comparing gender differences.