
Figures & data
Figure 1. Flowchart recruitment procedure, process leaders.
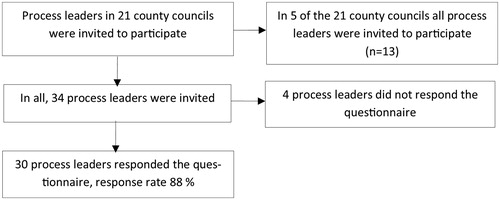
Figure 2. Flowchart recruitment procedure, clinicians working with CBT/IPT or MMR.
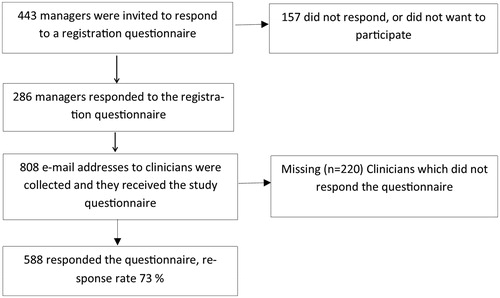
Table 1. County council process leaders’ level of agreement with statements about the 2015 rehabilitation guarantee following the Consolidated Framework for Implementation Research.
Table 2. Characteristics of participating clinicians presented separately for clinicians working with CBT/IPT and with MMR.
Table 3. Extent of contact with relevant stakeholders to enable workplace interventions.
Table 4. Clinicians’ responses to statements based on the consolidated framework for implementation research, presented separately for clinicians working with CBT/IPT (n = 348) and with MMR (n = 220).
Supplemental material