3,416
Views
7
CrossRef citations to date
0
Altmetric
Perspectives in Rehabilitation

Is there really a “golden hour” for work disability interventions? A narrative review

&
Pages 586-593 | Received 01 Dec 2017, Accepted 19 Jul 2018, Published online: 03 Jan 2019

Figures & data

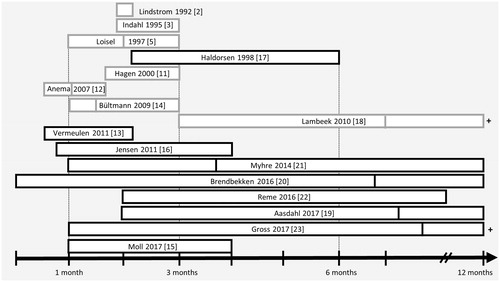
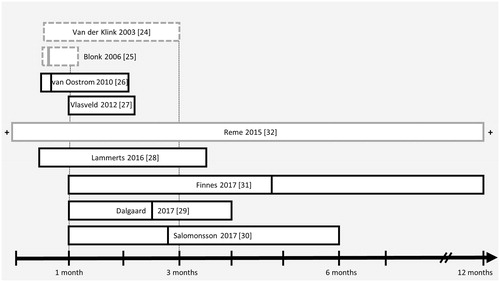
Table 1. Characteristics of included studies.

Figure 1. Boxes indicate length of sick leave at inclusion in studies including participants with musculoskeletal disorders. The vertical line through the box indicate the median/mean sick leave duration, when reported. Grey outline on the box means that the study reported an effect on return to work, while black indicates it did not. A plus sign indicate inclusion beyond the time illustrated on the x-axis. The Aasdahl-study included both musculoskeletal complaints and mental health disorders.

Figure 1. Boxes indicate length of sick leave at inclusion in studies including participants with musculoskeletal disorders. The vertical line through the box indicate the median/mean sick leave duration, when reported. Grey outline on the box means that the study reported an effect on return to work, while black indicates it did not. A plus sign indicate inclusion beyond the time illustrated on the x-axis. The Aasdahl-study included both musculoskeletal complaints and mental health disorders.

Figure 2. Boxes indicate length of sick leave at inclusion in studies including participants with mental health disorders. The vertical line through the box indicate the median/mean sick leave duration, when reported. Grey outline on the box means the study reported an effect on return to work, while black indicates it did not. A dotted box indicate that the inclusion criteria of the study is not clear. A plus sign indicate inclusion beyond the time illustrated on the x-axis.

Figure 2. Boxes indicate length of sick leave at inclusion in studies including participants with mental health disorders. The vertical line through the box indicate the median/mean sick leave duration, when reported. Grey outline on the box means the study reported an effect on return to work, while black indicates it did not. A dotted box indicate that the inclusion criteria of the study is not clear. A plus sign indicate inclusion beyond the time illustrated on the x-axis.