
Figures & data
Table 1. Patient characteristics.
Figure 1. Standard deviation of the difference between the PRWE pain score and the DT-PRWE pain score. Optimization of the CHAID-algorithm displaying the standard deviation of the difference between the original Patient Reported Wrist Evaluation (PRWE) and the decision tree-based PRWE (DT-PRWE) in the development set as a function of minimal bucket size and maximal depth of the CHAID-algorithm. A lower standard deviation indicates more similarity between both scores and therefore a better decision tree. The arrow indicates the decision tree that was selected for the PRWE-DT.
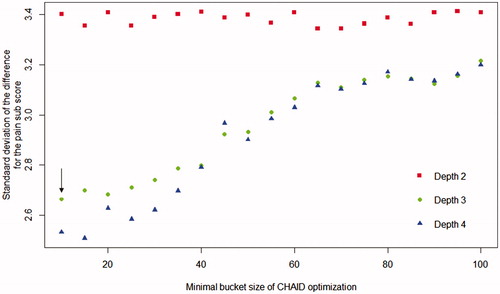
Figure 2. Standard deviation of the difference between the PRWE disability score and the DT-PRWE disability score. Optimization of the CHAID-algorithm displaying the standard deviation of the difference between the original Patient Reported Wrist Evaluation (PRWE) and the decision tree-based PRWE (DT-PRWE) in the development set as a function of minimal bucket size and maximal depth of the CHAID-algorithm. A lower standard deviation indicates more similarity between both scores and therefore a better decision tree. The arrow indicates the decision tree that was selected for the PRWE-DT.
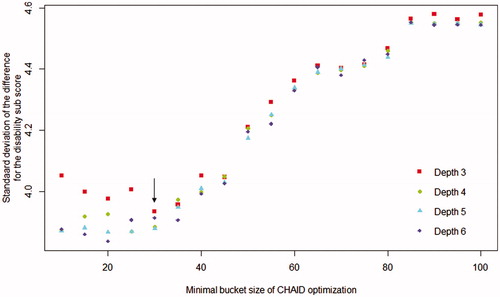
Figure 3. Distribution of the differences between original PRWE score and DT-PRWE. (A) shows this distribution for the pain sub score, (B) for the disability sub score and (C) for the total score of all questionnaires in the validation group. Furthermore, ICC of the total score is displayed for all questionnaires in the validation group.
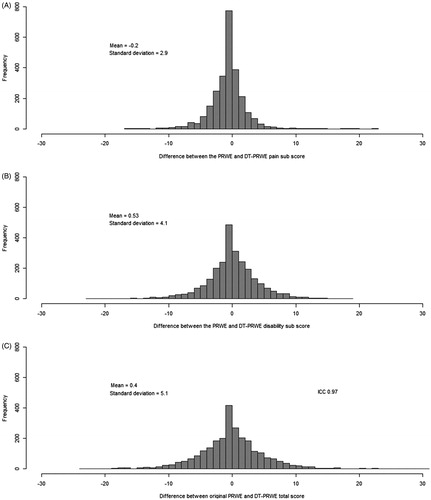
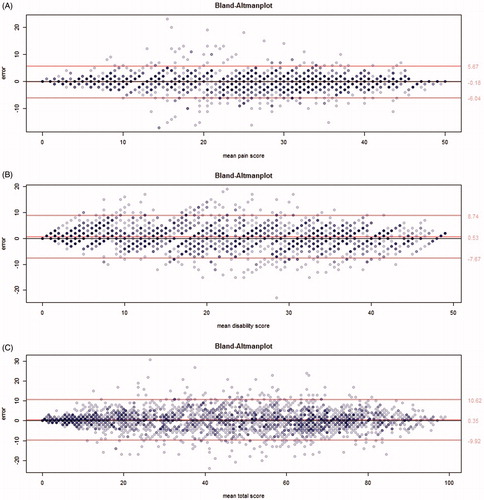
Figure 4. Bland-Altman plots displaying the agreement between the original PRWE and the decision tree PRWE. (A) shows this agreement for the pain subscore of the Patient Reported Wrist Evaluation (PRWE), (B) shows this agreement for the disability subscore of the Patient Reported Wrist Evaluation (PRWE), (C) shows this agreement for the total sumscore of the Patient Reported Wrist Evaluation. In all figures, the middle red line represents the mean error. The outer lines represent the 95% confidence interval. The darkness of the dots indicate the number of overlapping data points at the same location.
Data availability statement
All patients’ data were available but cannot be published in open access because it is owned by a third party, Xpert Clinic. Patient data can be shared upon request and when permission of Xpert Clinic is given. Please contact the corresponding author request access to the patient data.