Figures & data
Table 1. Baseline characteristics.
Figure 1. Participant flow through study. *Longitudinal analyses include all available data from each subject up to withdrawal or study completion.
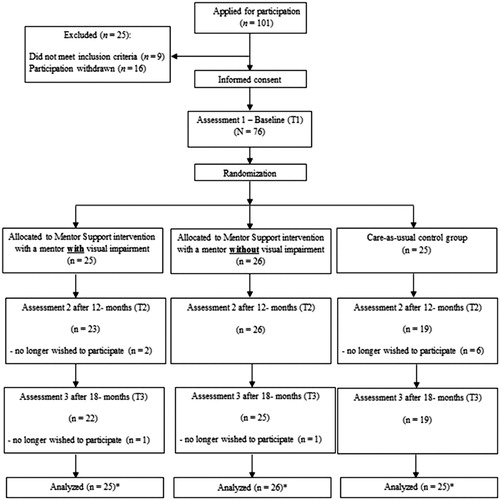
Table 2. Mean score and standard deviations of social participation outcome variables of both conditions, at the first assessment (T1), after 12 months at the second assessment (T2), and after 18 months at the third assessment (T3).
Table 3. Parameter estimates for multilevel model of effectiveness of the mentoring intervention on social participation outcome variables.
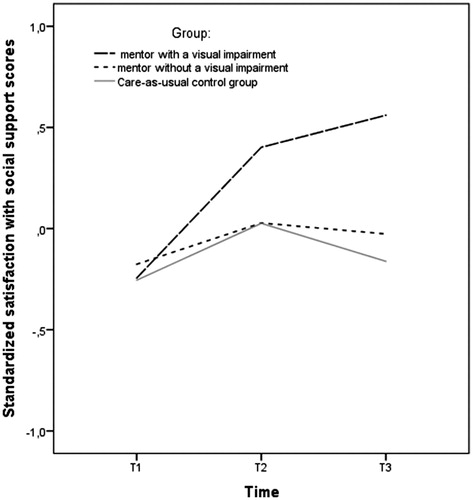
Figure 2. Standardized satisfaction with social support scores on three time points.