
Figures & data
Table 1. Participant characteristics.
Figure 1. Movement category proportions per participant and as a whole. (UU: unaffected upper limb movement; BiL: Bilateral movement; BiM: bimaual movement; AU: affected upper limb movement)
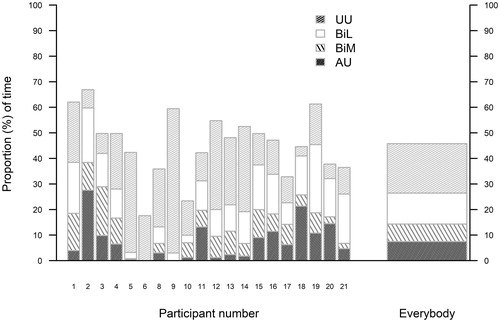
Figure 2. Spline analysis of UL activity with 95% confidence bands. Time periods containing the top 20% and bottom 20% of activity are lightly shaded. (UU: unaffected upper limb movement; BiL: Bilateral movement; BiM: bimaual movement; AU: affected upper limb movement)
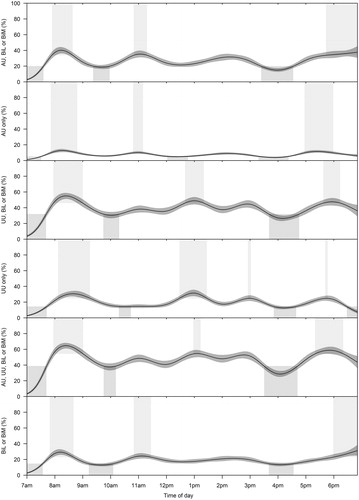
Table 2. Effect of meal time on three mutually-exclusive upper limb movement categories.