Figures & data
Figure 1. Acquiring functional manual wheelchair skill in the process of motor learning is a goal of rehabilitation. Considering the complexity and multidimensionality of the functional wheelchair skill, a number of factors needs to be taken in account to describe it. Although this study will not look at the association of mechanical efficiency and propulsion technique with other factors, we decided to include them here, to provide a complete picture of the multidimensional changes in physiology and skill during active SCI rehabilitation. Personal and wheelchair factors, as well as the wheelchair-user interface are not the focus of this study but it should be kept in mind that they could potentially influence both the baseline level of motor skill as well as the pace of the motor learning process.
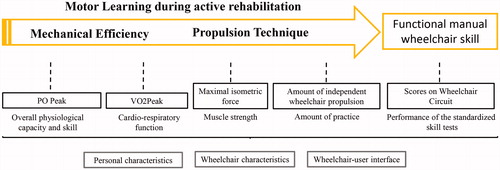
Table 1. Propulsion technique variables. All variables except cadence were calculated as an average value of all pushes performed during the last minute of each practice block. Equations from Vegter et al [Citation6].
Figure 2. Study design. The first and the last measurement in the group with a recent SCI (N = 8) and the measurement in the experienced group (N = 16) contained the full test battery. The second to fifth measurement in the recent group were meant to monitor the motor learning process and consisted only of a submaximal test to determine mechanical efficiency and propulsion technique.
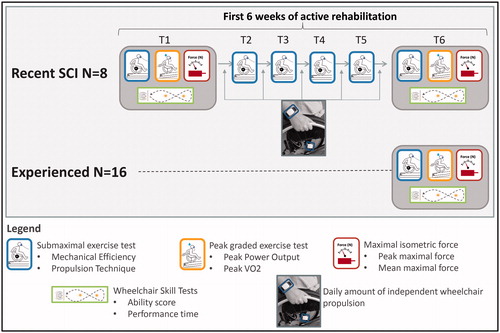
Figure 3. The submaximal exercise test was performed at each measurement occasion in the group with a recent SCI. Treadmill velocity and inclination were chosen for each participant based on their capabilities and were kept unchanged throughout the experiment. The right wheel was exchanged for an instrumented wheel with the same diameter, which continuously recorded the wheelchair propulsion technique. Oxygen consumption was determined breath-by-breath.
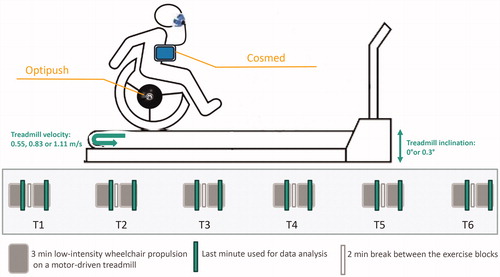
Table 2. Personal and lesion characteristics for the group with a recent SCI (N = 8) and the experienced group (N = 16).
Figure 4. Individual moment around the wheel axis during the first and the last measurement occasion for each participant in the group with a recent SCI (N = 8).
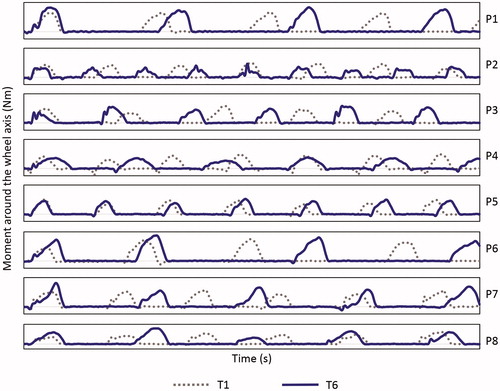
Table 3. Longitudinal course (T1–T6) in mechanical efficiency and propulsion technique in the group with a recent SCI and the course of the amount of independent wheelchair propulsion (bottom two lines).
Table 4. Results of the wheelchair skill tests, maximal test and maximal force test performed in the group with a recent SCI at the pre- (T1) and the post-test (T6).
Table 5. Results of the between-group comparison. Effects with and without the relative power output correction.
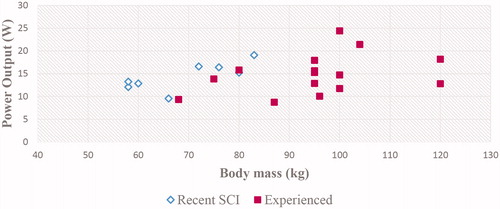
Figure 5. Scatter plot illustrating the relationship between body mass and absolute power output during submaximal exercise test in the group with a recent SCI (N = 8, x̄=14.4 W ± 3.0 W) and the experienced group (N = 16, x̄=14.9 W ± 4.4 W). With the large difference in body mass (24 kg), this leads to a respective relative power for the recent and experienced group of 0.21 W/kg and 0.16 W/kg (p = 0.006).