
Figures & data
Figure 1. The elements of the “Physical Activity Counseling Center” as part of the implementation of the Rehabilitation, Sport and Exercise program.
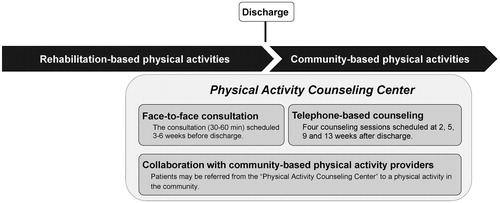
Table 1. Description of the process outcomes.
Figure 2. The number of patients that participated in the Rehabilitation, Sport and Exercise program each half year of the program period (period 1–5). Note. Mean and SD of the number of patients per institution (n = 18) are depicted in the top-right box.
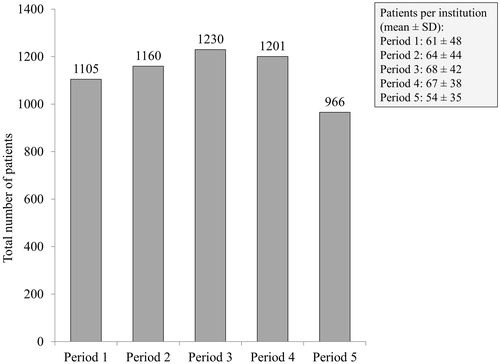
Table 2. Characteristics of received counseling of the distinct profiles.
Table 3. Patients’ characteristics of the distinct profiles.
Table 4. Physical activity outcomes during (T0) and after (T1) rehabilitation presented per profile and results of the multilevel analyses.
Supplemental material