Figures & data
Table 1. Personal and injury characteristics.
Figure 1. Explained variance (Pearson’s correlation R2) at Intermediate-skills-test 1, 2, and 3 for the 9 predictors. An R2 above .20 is significant (p < 0.05), N = 20.
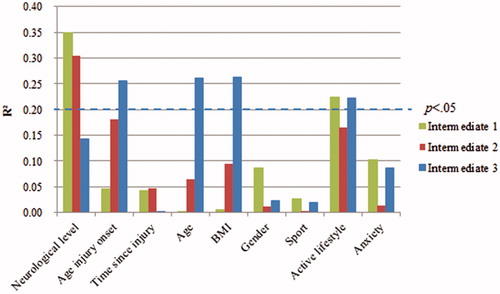
Figure 2. Scatterplot for the predictors with a significant correlation with exoskeleton skill performance (p < 0.05) at Intermediate-skills-test 1, 2, and 3.
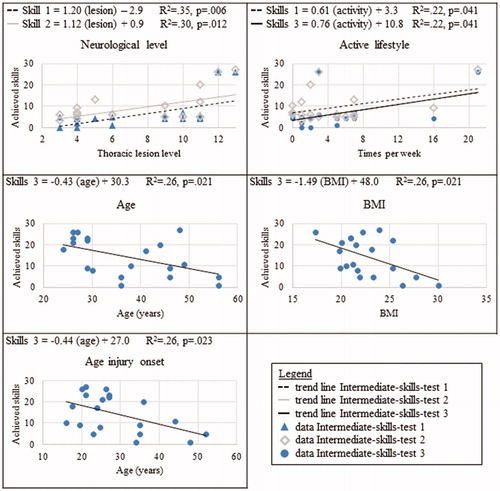
Table 2. Multiple forward stepwise regression.
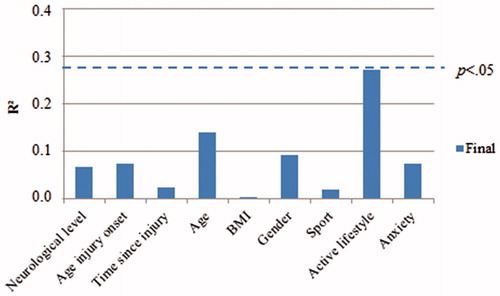
Figure 3. Explained variance (Pearson’s correlation R2) of the average achieved final skills for the 9 predictors.