
Figures & data
Table 1. Characteristics of participating occupational health professionals (N = 192).
Figure 1. Distribution of responses for assessment of significant others’ illness perceptions by occupational health professionals (Median = 2.8, IQR = 2.0–3.0).
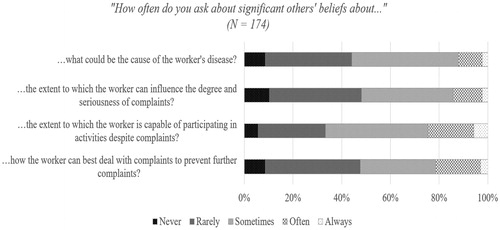
Figure 2. Distribution of responses for assessment of significant others’ work-related beliefs and expectations by occupational health professionals (Median = 2.5, IQR = 2.0–3.0).
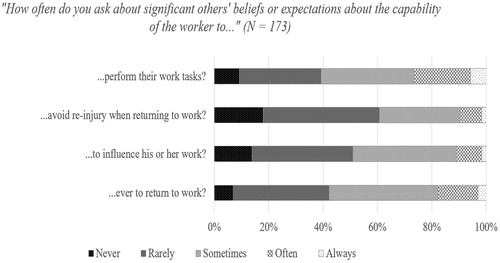
Figure 3. Distribution of responses for assessment of significant others’ behavioral responses by occupational health professionals (Median = 3.0, IQR = 2.9–3.5).
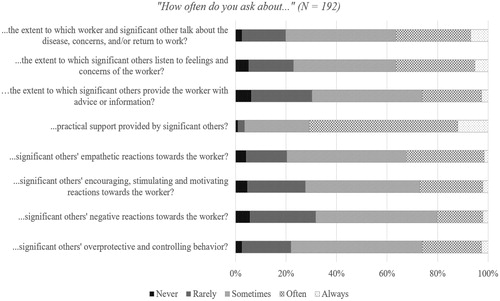
Table 2. Univariate and multiple regression analyses for variables predicting OHPs’ assessment of significant others’ illness perceptions, work-related beliefs and expectations, and behavioral responses.
Table 3. Description of qualitative data on occupational health professionals’ reasons whether or not to ask about significant others’ cognitions and behavioral responses.
Supplementary_Table_S1.docx
Download MS Word (19.8 KB)Data availability
The dataset generated during this study is available from the corresponding author upon reasonable request.