
Figures & data
Figure 1. The set-up of the Interactive Walkway with various walking adaptability tasks (insets).
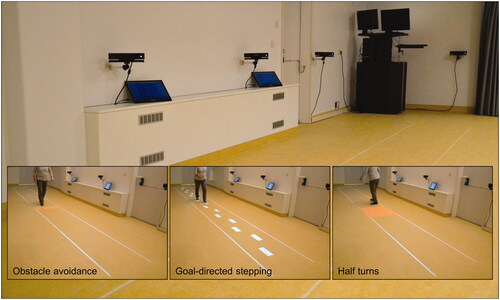
Table 1. In- and exclusion criteria for stroke patients and controls.
Figure 2. Schematics of unconstrained walking and walking adaptability tasks on the Interactive Walkway. The available response distance of the suddenly appearing obstacles and cues varied over subjects depending on their own gait characteristics.
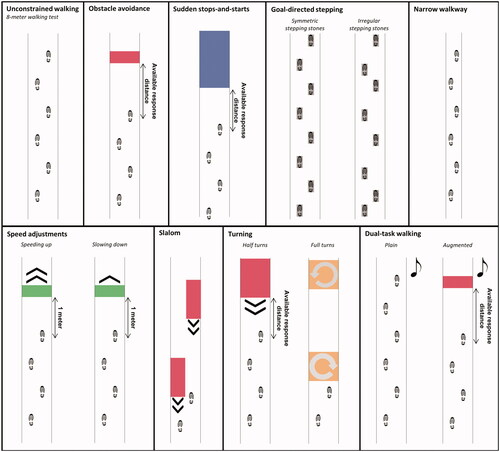
Table 2. Interactive Walkway tasks and outcome measures.
Table 3. Means, standard deviations and between-groups statistics of outcome measures of clinical tests, unconstrained walking and walking adaptability tasks on the Interactive Walkway for stroke patients and controls.
Figure 3. Overview of the correlation coefficients between commonly used clinical test scores [TUG, 10MWT-CWS, 10MWT-MWS, TBA, BBS, FRT] (x-axis), spatiotemporal gait parameters of unconstrained walking [UW1-9] (x-axis) and Interactive Walkway walking-adaptability outcome measures (OA1-3, SSS1-3, GDS1-4, NWW1-3, SA1-4, S1-2, T1-3, DT1-4; y-axis) in stroke patients. The order and abbreviations of the outcome measures on the axes is in agreement with .
![Figure 3. Overview of the correlation coefficients between commonly used clinical test scores [TUG, 10MWT-CWS, 10MWT-MWS, TBA, BBS, FRT] (x-axis), spatiotemporal gait parameters of unconstrained walking [UW1-9] (x-axis) and Interactive Walkway walking-adaptability outcome measures (OA1-3, SSS1-3, GDS1-4, NWW1-3, SA1-4, S1-2, T1-3, DT1-4; y-axis) in stroke patients. The order and abbreviations of the outcome measures on the axes is in agreement with Table 3.](/cms/asset/335ef445-5648-4eb2-9a0b-57b5da0c614a/idre_a_1731852_f0003_c.jpg)
Supplementary_file_S2.pdf
Download PDF (452.1 KB)Supplementary_file_S1.pdf
Download PDF (114.8 KB)Supplementary_video_S1.mp4
Download MP4 Video (28.4 MB)Data availability statement
The data that support the findings of this study are available from the corresponding author, DJG, upon reasonable request.