
Figures & data
Figure 1. The WHO’s model for the International Classification of Functioning, Disability and Health [Citation31] and adapted to persons with a spinal cord injury (SCI) who are wheelchair-dependent (∼80% of the population). Originally published in International Classification of Functioning, Disability and Health; Geneva: World Health Organization; 2001. Licence: CC BY-NC-SA 3.0 IGO).
![Figure 1. The WHO’s model for the International Classification of Functioning, Disability and Health [Citation31] and adapted to persons with a spinal cord injury (SCI) who are wheelchair-dependent (∼80% of the population). Originally published in International Classification of Functioning, Disability and Health; Geneva: World Health Organization; 2001. Licence: CC BY-NC-SA 3.0 IGO).](/cms/asset/40185993-97d4-4916-88cc-36b89a93e70e/idre_a_1806365_f0001_b.jpg)
Figure 2. Some personal observations on supportive, rehabilitation, and assistive technologies (RT + AT), and their appreciation by professionals and rehabilitation institutes (Rehabilitation Magazine (RM)) in general.
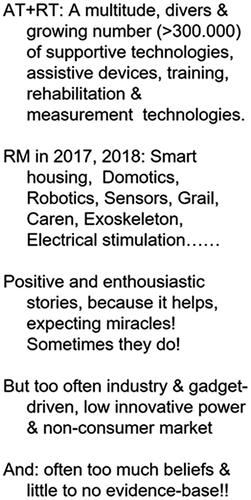
Figure 3. A biomechanics summary of the physical stress (PO(W)), strain and work capacity (POaer (W)) for a virtual handrim-wheelchair user force (F) with a spinal cord injury who is negotiating a 16% ramp: he/she may not be able to negotiate the ramp due to a lack of sufficient peak power (POaer). This is apart from the potential risk for shoulder injuries in the majority of manual wheelchair users.
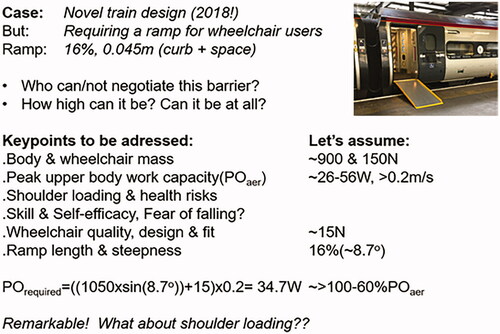
Figure 4. Averages (±SEM) of (assisted) mechanical efficiency, heart rate, left-right and forward-backward deviation and stroke frequency of each session of low-intensity practice for a regular handrim-wheelchair group (RHW; n = 12) and a power-assist wheelchair group ((PAPAW; n = 12) on the level treadmill. All subjects are healthy novices without prior wheelchair experience. This figure was adapted from De Klerk et al. [Citation13] and “this article is distributed under the terms of the Creative Commons Attribution 4.0 International License (http://creativecommons.org/licenses/by/4.0/), which permits unrestricted use, distribution, and reproduction in any medium, provided you give appropriate credit to the original author(s) and the source, provide a link to the Creative Commons license, and indicate if changes were made. The Creative Commons Public Domain Dedication waiver (http://creativecommons.org/publicdomain/zero/1.0/) applies to the data made available in this article, unless otherwise stated.”
![Figure 4. Averages (±SEM) of (assisted) mechanical efficiency, heart rate, left-right and forward-backward deviation and stroke frequency of each session of low-intensity practice for a regular handrim-wheelchair group (RHW; n = 12) and a power-assist wheelchair group ((PAPAW; n = 12) on the level treadmill. All subjects are healthy novices without prior wheelchair experience. This figure was adapted from De Klerk et al. [Citation13] and “this article is distributed under the terms of the Creative Commons Attribution 4.0 International License (http://creativecommons.org/licenses/by/4.0/), which permits unrestricted use, distribution, and reproduction in any medium, provided you give appropriate credit to the original author(s) and the source, provide a link to the Creative Commons license, and indicate if changes were made. The Creative Commons Public Domain Dedication waiver (http://creativecommons.org/publicdomain/zero/1.0/) applies to the data made available in this article, unless otherwise stated.”](/cms/asset/60dc5d8c-1153-4693-a3e7-be4636a2eabb/idre_a_1806365_f0004_c.jpg)
Figure 5. Esseda (Lode BV, Groningen, The Netherlands) in left panel and the potential role of sensor-based smart power-support and monitoring for new generations of power-assist wheelchairs (bottom) and regular handrim-wheelchair propulsion (top) at the right panel.
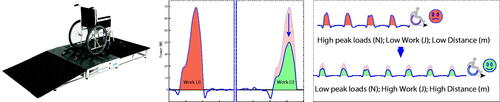
Figure 6. Global disability demographics following the World Health Organization. Published in World Report on Disabilities. Geneva: World Health Organization; 2011. Licence: CC BY-NC-SA 3.0 IGO.
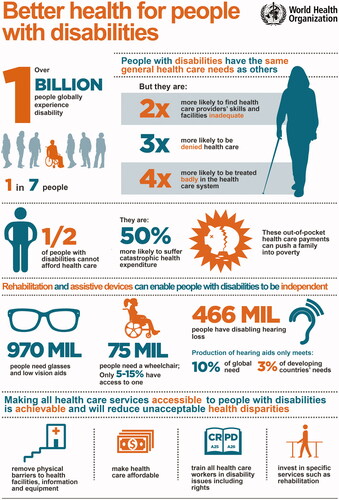
Figure 7. Infographic on Physical Activity for disabled adults. Published in: UK Chief Medical Officers’ physical activity guidelines, 7 September 2019, Department of Health and Social Care; ©Crown copyright 2019, this publication is licensed under the terms of the Open Government Licence v3.0, except where otherwise stated (nationalarchives.gov.uk/doc/open-government-licence/version/3).
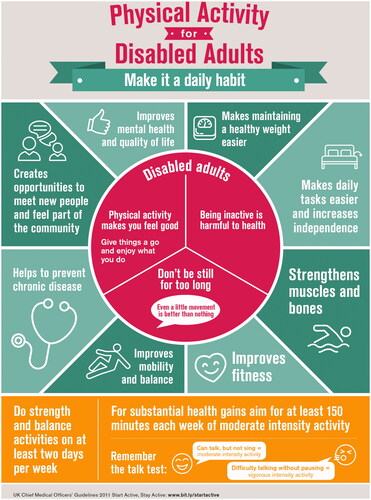
Figure 8. The benefits of physical activity as postulated in this theoretical dose-response association presented by William Haskell in his 1994 Wolffe Memorial Lecture at the American College of Sports Medicine annual meeting [Citation118]; the lower the fitness, the greater the benefits of a more physically active lifestyle. This figure was reproduced with permission from Haskell and Wolfe [Citation118].
![Figure 8. The benefits of physical activity as postulated in this theoretical dose-response association presented by William Haskell in his 1994 Wolffe Memorial Lecture at the American College of Sports Medicine annual meeting [Citation118]; the lower the fitness, the greater the benefits of a more physically active lifestyle. This figure was reproduced with permission from Haskell and Wolfe [Citation118].](/cms/asset/0b6e8a07-9c9f-49e8-ad3a-6a2cfef119d2/idre_a_1806365_f0008_b.jpg)