
Figures & data
Table 1. Participant characteristics.
Figure 1. The course of the proportion of participants (who completed the follow up till four years after stroke, n = 136) experiencing restrictions in participation items over time.
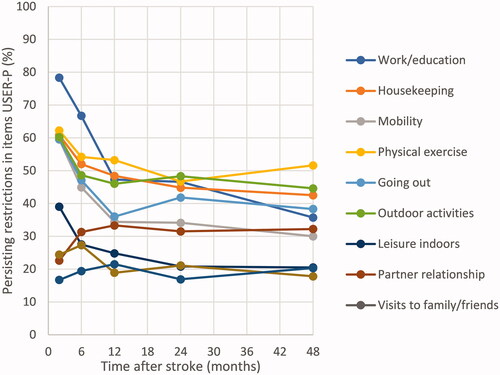
Table 2. Course of participation after stroke of participants who completed the follow up till four years after stroke (n = 136).
Table 3. Linear mixed model analyses showing the predictions of participation restrictions (USER-P restrictions subscale) over time.
Data availability statement
The data that support the findings of this study are available from the corresponding author upon reasonable request.