Figures & data
Figure 1. Enrolment and follow-up of the trial participants.
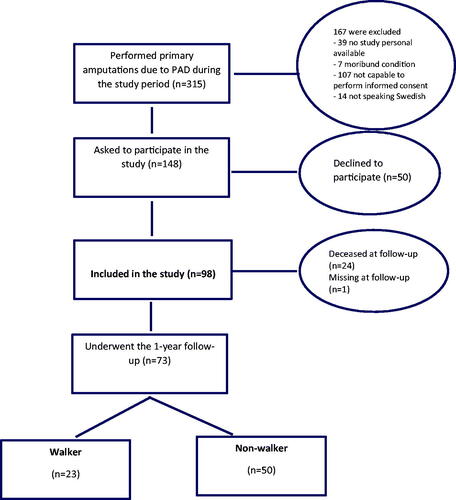
Table 1. Baseline characteristics of patients that completed follow-up (n = 73).
Table 2. Characteristics wearing habits of the prosthesis, according to Houghton scale, n = 53.
Figure 2. Dimensions of EQ-5D-3L at baseline between walker and non-walker amputees. Median values with p-values based on Mann–Whitney U test with eta square as effect size (η2). Higher value indicates more severe problem.
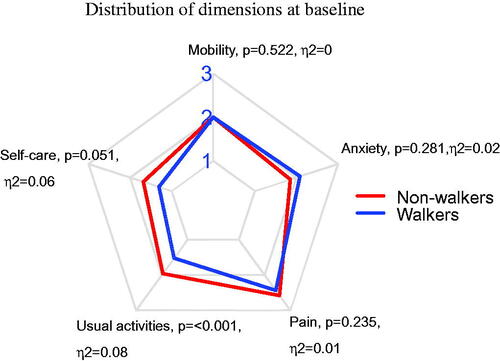
Figure 3. Dimensions of EQ-5D-3L at follow-up between walker and non-walker amputees. Median values with p-values based on Mann–Whitney U test with eta square as effect size (η2). Higher value indicates more severe problem.
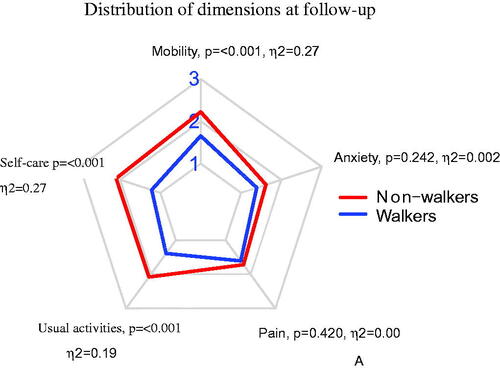
Figure 4. Health status in relation to prosthesis use.
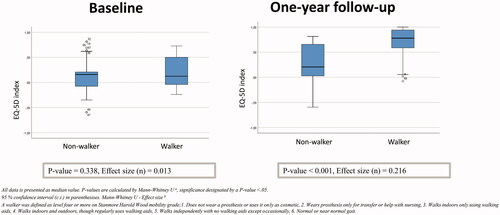
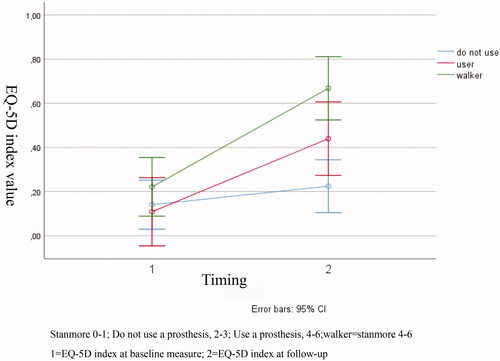
Figure 5. HRQoL using EQ-5D index at baseline and follow-up between non-user, user and walker.