
Figures & data
Table 1. Participants’ descriptive statistics at baseline for participants included (n = 206) and excluded (n = 97) in the latent class growth mixture modelling analyses.
Figure 1. Three trajectory model of perceived fatigue (FSS score) during and after rehabilitation in people after stroke (n = 206), based on latent class growth mixture modelling.
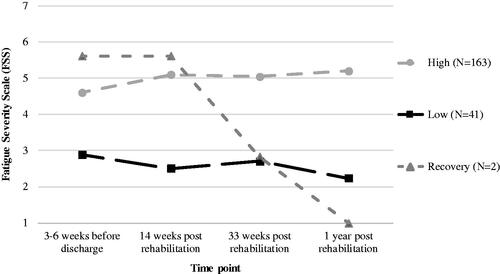
Figure 2. Individual trajectories within each trajectory of perceived fatigue, based on latent class growth mixture modelling: (A) High, n = 163, (B) Low, n = 41, (C) Recovery, n = 2.
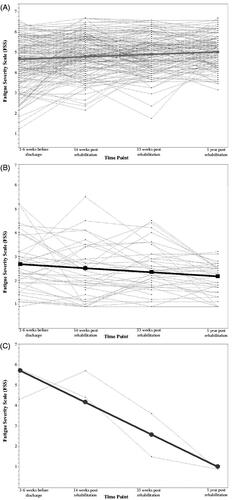
Table 2. Fit indices for latent class growth mixture models with 1–4 trajectories of perceived fatigue (FSS score) in people after stroke rehabilitation (n = 206).
Table 3. Descriptive statistics of characteristics 3–6 weeks before discharge (T0) for the high (n = 163) and low (n = 41) trajectories of perceived fatigue among people after stroke and binomial multivariate logistic regression analysis to distinguish between those trajectories.
Figure 3. Self-reported physical activity (min/week) during and after rehabilitation in the high (n = 163) and low (n = 41) trajectories of perceived fatigue, based on descriptive statistics (medians).
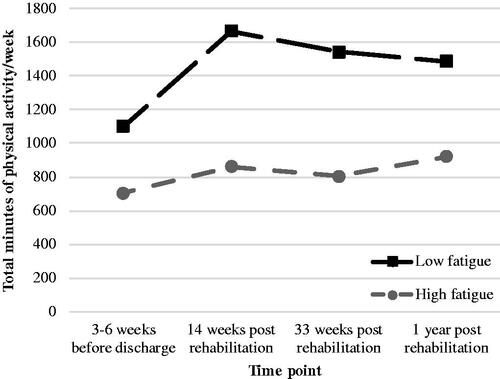
Table 4. Results of the multilevel regression analyses for the outcome – total minutes of self-reported physical activity per week – in three subsequent models for determinants perceived fatigue (model 1), awareness of activity pacing (model 2) and risk of overactivity (model 3) for data from T0 to T3 in people after stroke (n = 204).