
Figures & data
Table 1. Demographic characteristics.
Table 2. Convergent validity: correlations between the MobQoL items and the dimensions of the EQ-5D-5L and ICECAP-A.
Table 3. Summary of all basic measurement and psychometric properties per MobQoL item.
Figure 1. Differential item function by gender. Items are ordered by difficulty, from lowest difficulty (“Activities”) to highest difficulty (“Social inclusion”). The y axis shows the difficulty (in logits) of each item for each person classification (i.e., male or female).
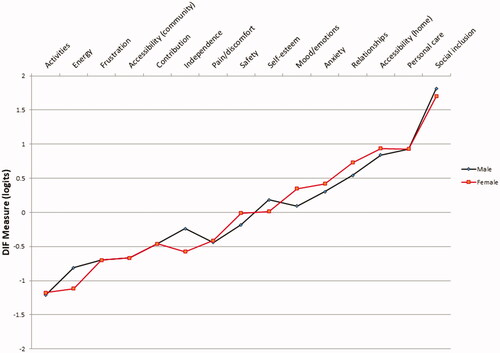
Table 4. Correlation matrix for the retained MobQoL items.
Figure 2. Scree plot from exploratory factor analysis. Eigenvalues summarise the variance in the data which is reproduced by identified factors. The inflexion point is the point at which the line flattens, indicating minimal reproduced variance per factor.
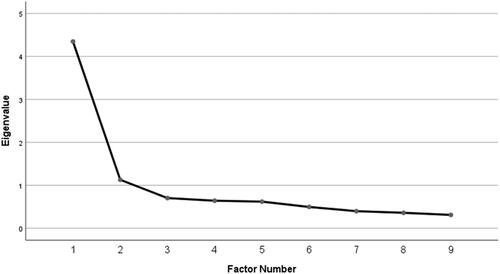
Table 5. Results from the exploratory factor analysis.
Table 6. Pattern matrix: factor loadings from exploratory factor analysis.
Table 7. Scale and sub-scale fit to the Rasch model.
Figure 3. Example of category probability curve for the “Accessibility (home)” item. Each line refers to the probability of a given response choice (i.e., categories labelled 1 [most positive] to 4 [most negative]) relative to item difficulty .
![Figure 3. Example of category probability curve for the “Accessibility (home)” item. Each line refers to the probability of a given response choice (i.e., categories labelled 1 [most positive] to 4 [most negative]) relative to item difficulty .](/cms/asset/1c1a395b-4cce-415b-a3e0-5959e34f7aca/idre_a_1844319_f0003_c.jpg)
Figure 4. “Most probable response” map. The “most probable response” map shows the most likely combinations of item responses at various levels of severity, expressed in logits on the x axis. The area to the extreme left corresponds to response category 1 (most positive); the area to the extreme right corresponds to response category 4 (most negative). Category numbers are shown to the left of the modal area. Expected threshold locations are illustrated as the spaces between response choices, and show the likely responses on the MobQoL-7D at various severity levels.
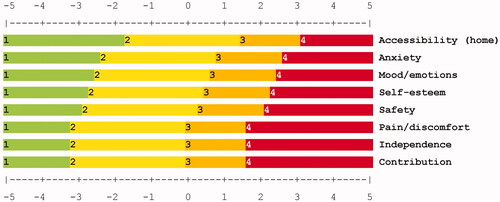
Table 8. Item fit to the Rasch model.
Table 9. Sub-scale fit to the Rasch model.
Table 10. Item fit to the Rasch model per sub-scale.
Table 11. MobQoL-7D health state classification system.