Figures & data
Figure 1. Flowchart of stroke and transient ischemic attack patients’ admission to the hospital in the period of 1st April 2016 to 15th May 2017, to participation in the stroke aftercare study. The local university hospital admits nearly 700 stroke and transient ischemic attack cases annually.
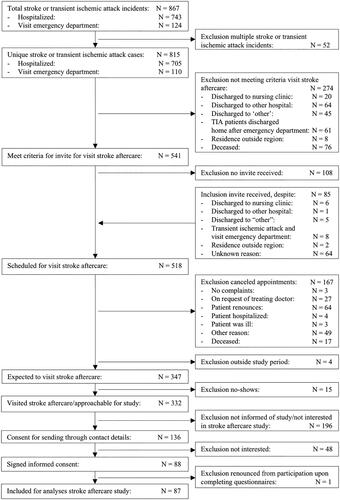
Table 1. Characteristics of persons who participated in the stroke aftercare cohort versus non-responders.
Table 2. Characteristics of the stroke aftercare cohort versus care-as-usual cohort.
Table 3. Change over time in emotional and psychosocial outcome for the stroke aftercare cohort.
Table 4. Rate of change in outcomes of the stroke aftercare cohort versus the care-as-usual cohort.
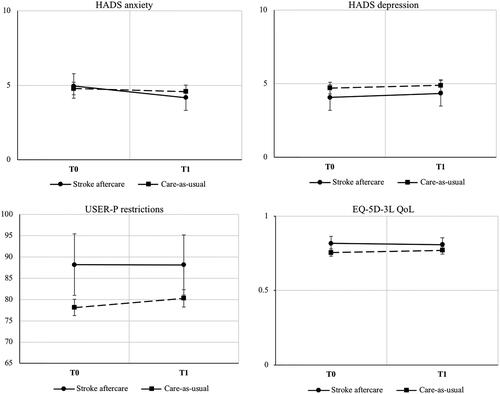
Figure 2. Graphs displaying outcomes over time of the stroke aftercare and care-as-usual. Note: coefficients are estimated marginal means of the multilevel model. HADS: Hospital Anxiety and Depression Scale; USER-P: Utrecht scale for Evaluation of Rehabilitation- Participation; EQ: EuroQol; QoL: Quality of Life.