
Figures & data
Figure 1. Flowchart of the response rate of baseline and follow-up questionnaire aimed at persons granted assistance allowance.
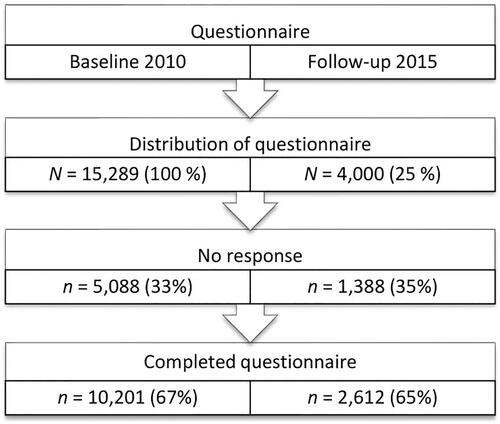
Table 1. Registry data categories and variables showed for respondents in 2010, 2015 and sample.
Table 2. PA categories and activities for 2015 for total population and difference in proportion of items between 2010 and 2015 showing percent and p value (n = 2565).
Table 3. Share of PA categories and activities for 2015 for increased (n = 905), no change (n = 1511), or reduced (n = 194) hours of assistance allowance and difference in share of items between 2010 and 2015, showing percent and p value (n = 2565).
Table 4. PA categories and activities 2015 for age groups < 30 years (n = 749), 30–50 years (n = 668), >50 years (n = 1238), and difference in proportions of items between 2010 and 2015, showing percent and p value (n = 2565).
Table 5. PA categories and activities for 2015 for eligible person categories, intellectual (n = 942), physical (n = 138), special needs (n = 1456), and difference in proportion of items between 2010 and 2015, showing percent and p value (n = 2565).
Table 6. PA categories and activities for 2015 for men and women and difference in proportion of items between 2010 and 2015, showing percent and p value (n = 2565).
Table 7. Binomial mixed model showing PA categories, activities, and proportions of items across time 2010–2015, gender 2015 and interaction over gender and hours 2010–2015.