
Figures & data
Figure 1. Flowchart for the selection of data for analysis in the study.
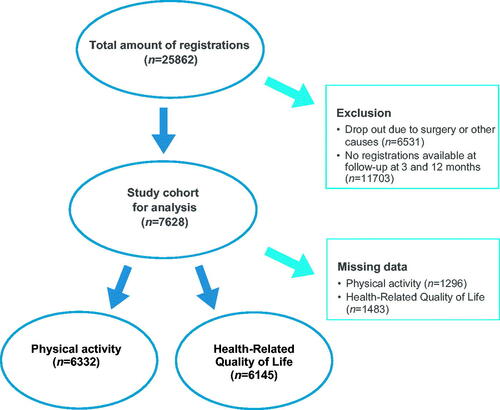
Figure 2. Model for calculation of activity minutes.
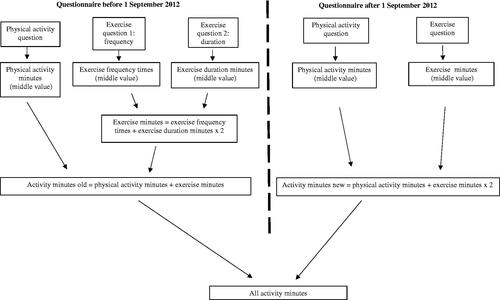
Table 1. Differences in physical activity for men (n = 1721) and women (n = 4611), and in health-related quality of life (HRQoL)a for men (n = 1654) and women (n = 4491) at baseline and at follow-up at 3 and 12 months.
Table 2. Difference in proportion (%) of men and women in increase, decrease or no change in physical activity, and health-related quality of life (HRQoL)a between baseline and follow-up at 3 and at 12 months.
Table 3. Differences in proportion (%) of men and women in change of physical activity group (insufficient to sufficient PA, still sufficient PA, still insufficient PA, and sufficient to insufficient PA), between baseline and follow-up at 3 and at 12 months.