
Figures & data
Table 1. Characteristics of the participants with stroke (n = 10) based on data collected at stroke onset, 16 months and 10 years after stroke.
Figure 1. The dynamic process of employing different strategies for social and leisure participation after stroke.
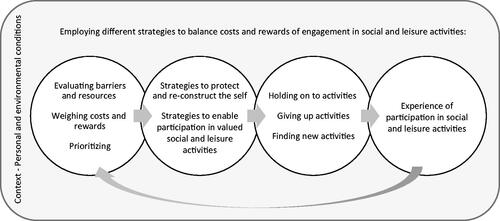
Table 2. Theme, main categories and sub-categories representing strategies for participation in social and leisure activities after stroke.