
Figures & data
Table 1. Participant characteristics.
Table 2. Type and number of perceived problems.
Figure 1. Severity of perceived problems (n = 207).
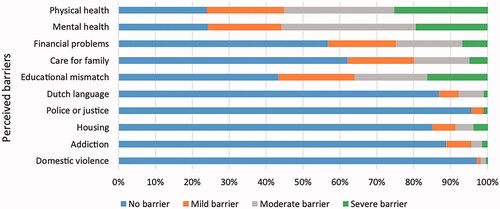
Figure 2. Prevalence of perceived problems (n = 207).
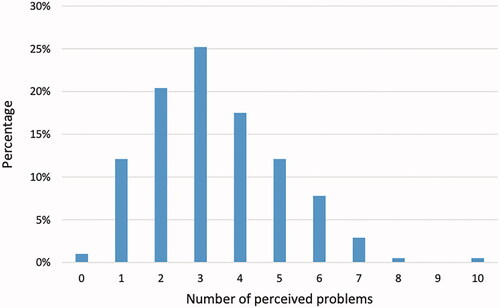
Figure 3. Most frequent combinations of problems.
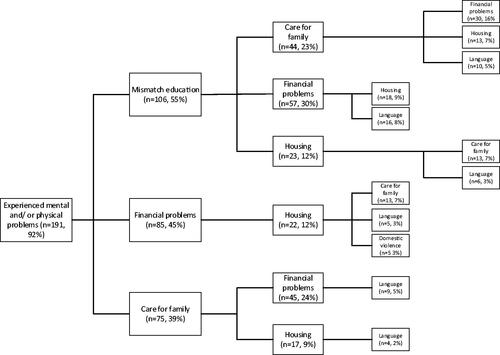
Table 3. Heat map with additional problems (n = 207)Table Footnotea
Table 4. Univariate and multivariate linear regression associations between sociodemographic characteristics and number of perceived barriers.
Supplemental material