
Figures & data
Figure 1. Study design.
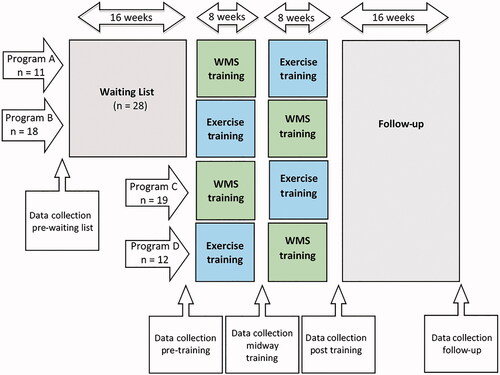
Figure 2. Line graph of the change in mean score over time for the total group, program A and C, and program B and D per outcome parameter. *Significant difference in outcome for order of training. UP-WMST: Utrecht Pediatric Wheelchair Mobility Skills Test; SRiT: Shuttle Ride Test; MPST: Muscle Power Sprint Test.
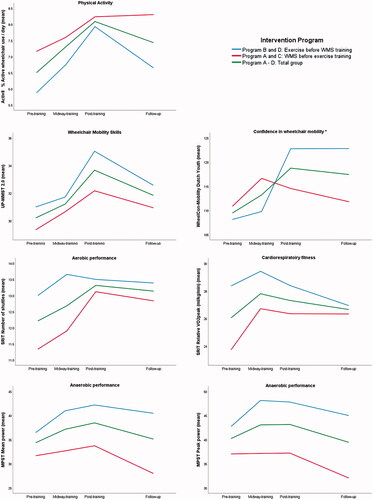
Table 1. Characteristics of participants.
Table 2. Short- and long-term effects per outcome parameter of combined exercise and wheelchair mobility skills training using a multilevel model analyses.
Table 3. Unpaired sample t-test total group and waiting list group.