
Figures & data
Figure 1. Flowchart of Intervention study and Follow-up including participant number, performed training method and data collection time points. Only data collected from participants that participated at all data collecting time points during Intervention study and Follow-up were included into the analysis: Pre-intervention (PRE), post-intervention (POST), one year post-intervention (T12) and two years post-intervention (T24). HIT/HIRT: high-intensity interval endurance and strength training; MICT: moderate-intensity continuous training; IG: intervention group; CG: control group; ⩒O2peak: peak oxygen consumption; 1RM = one-repetition maximum test; HADS-D: Hospital Anxiety and Depression Scale.
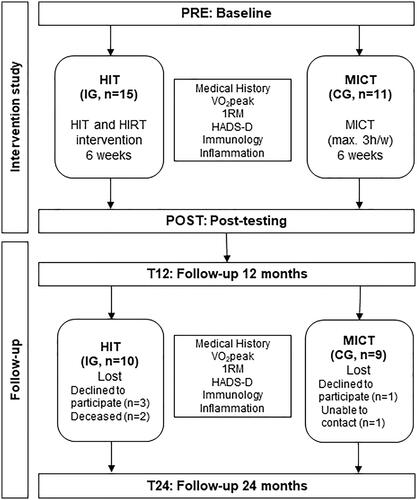
Table 1. Anthropometric data, medical treatments and physical activity of the female intervention group and control group during the original intervention study and during the 24-month follow-up period.
Figure 2. Aerobic capacity and strength of intervention and control group during Intervention study and Follow-up. (A) Observed increase of ⩒O2peak at POST in IG compared to PRE could not be observed at T12 and T24. ⩒O2peak of CG significantly increased from to PRE to T24. (B) Normalized Mean 1RM (starting point PRE = 100%) of IG increased at POST, decreased significantly at T12 but remained increased regarding PRE during Follow-up. Significant differences to PRE could be measured at POST and T24 for CG with increased values.
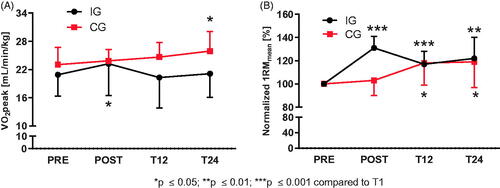
Figure 3. Anxiety and Depression scores for intervention and control group assessed by the Hospital Anxiety and Depression Scale (HADS-D). (A) Anxiety (Arbitrary Units, AU) experienced by IG decreased after PRE and remained significantly reduced at T12 and T24. Anxiety in CG did not differ over all-time points. (B) Depression (AU) determination revealed decreased scores for IG at POST and T24 compared to PRE. CG values remained unchanged.
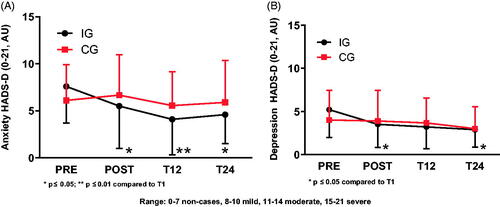
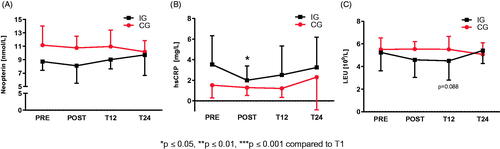
Figure 4. Neopterin, high-sensitive C-reactive protein and leucocyte concentration as markers for the immunological and inflammatory status. (A) Neopterin did not differ at all-time points for IG and CG. (B) HsCRP concentration of IG decreased at POST but did no longer differ at T12 and T24 compared to PRE. CG hsCRP concentration did not show any differences at all-time points. (C) Leucocyte concentrations for IG and CG showed no difference at all-time points.
Data availability statement
Raw data were generated at Ulm University Hospital, Division of Sports and Rehabilitation Medicine. Derived data supporting the findings of this study are available from the corresponding author (S.V.W.S) on request.