
Figures & data
Figure 1. Response-rates and retention rates in LoRDIA.
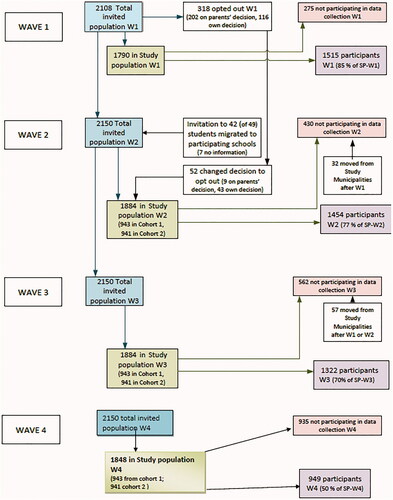
Figure 2. Trajectories of total difficulties for adolescents with and without self-rated NDD and gender.
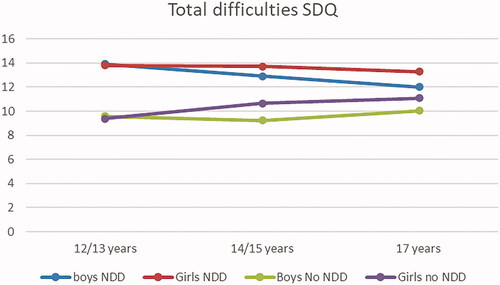
Figure 3. Emotional difficulties over time for adolescents with and without self-rated NDD and gender.
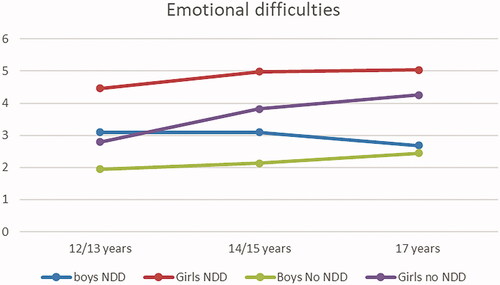
Figure 4. Psychosomatic complaints over time for adolescents with and without NDD and gender.
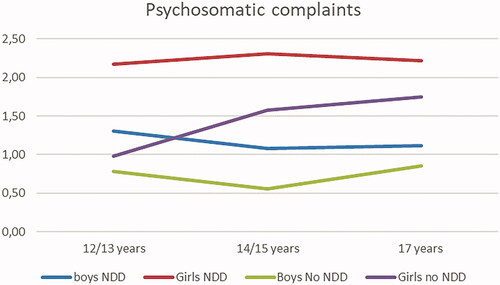
Table 1. Number of adolescents divided by gender and neurodevelopmental disorders (NDD).
Table 2. Values of SDQ scales divided by timepoint, gender, and NDD status.
Figure 5. Hyperactivity over time for adolescents with and without self-rated NDD and gender.
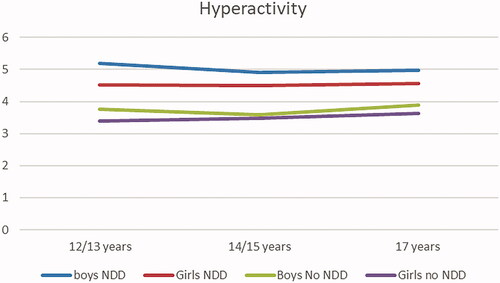
Figure 6. Impact over time for adolescents with and without self-rated NDD and gender.
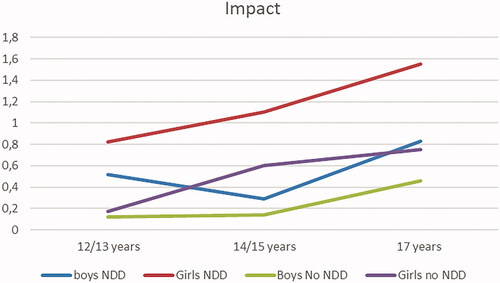
Table 3. Mean value of participation in different age groups divided by NDD and gender.
Table 4. Relation between mental participation, mental health problems and mental health over time.
Table 5. Concurrent relation between mental health, mental health problems, and participation.
Table 6. Mental health, mental health problems and participation in groups based on NDD status and gender mean (SD).