
Figures & data
Figure 1. Flowchart of study selection process. Adapted from Moher et al. [Citation21].
![Figure 1. Flowchart of study selection process. Adapted from Moher et al. [Citation21].](/cms/asset/766b52a9-319f-46a8-b372-d7986a29bc38/idre_a_1969452_f0001_c.jpg)
Figure 2. Forest plot of the 52 intervention arms included in the overall meta-analysis.
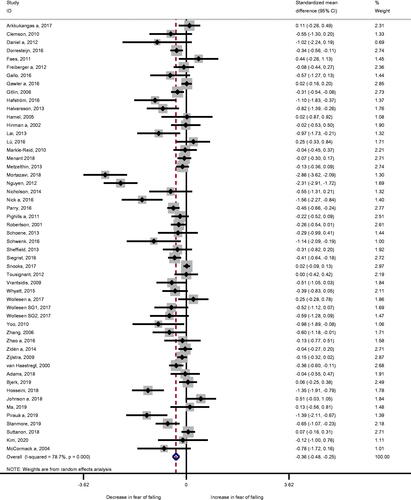
Table 1. Meta-regression results for intervention components for the first available follow-up after the intervention.
Supplemental material
Supplemental Material
Download MS Excel (40.4 KB)Supplemental Material
Download PDF (97.6 KB)Supplemental Material
Download MS Word (40 KB)Supplemental Material
Download MS Word (19.6 KB)supplementary_file_6_bubble_plots_16-06-2021.docx
Download MS Word (62.7 KB)supplementary_file_5_references_of_included_studies_08-06-2021.docx
Download MS Word (120.3 KB)supplementary_file_2_search_strategy_08-06-2021.docx
Download MS Word (29.5 KB)Data availability statement
The data that support the findings of this study are openly available in Open Science Framework at https://doi.org/10.17605/OSF.IO/SF67D.