
Figures & data
Table 1. Survey constructs, example items, and prefabricated responses.
Table 2. Operational definitions of visual problems, visual perception and visual neglect provided to research participants within the survey.
Figure 1. Flowchart of participant inclusion and exclusion process. *Survey completions include instances where respondents reached the end of the survey with most items completed (≥95%); **Excluded due to out of area (n = 3), other clinical specialty (n = 12), or missing key information (n = 19).
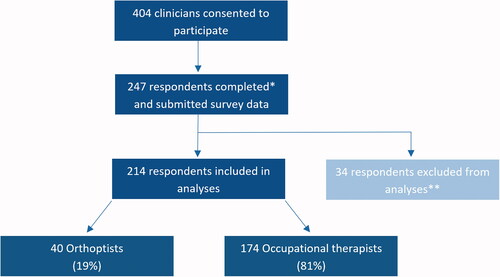
Figure 2. Geographical Spread of Clinician Respondents. Instances of missing region data from UK clinicians were n = 3.
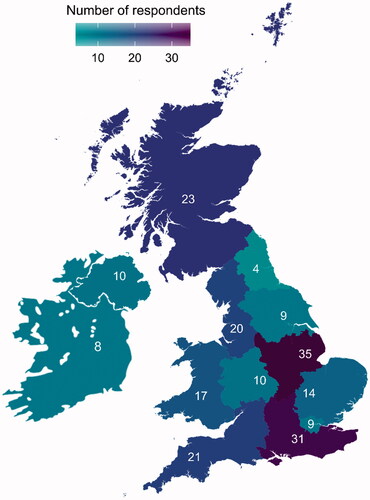
Figure 3. (A, B) Definitions and importance of sensory visual and visual perception domains, as rated by occupational therapists. Response rates for all items herein fall between 98 and 100% (n = 170–174).
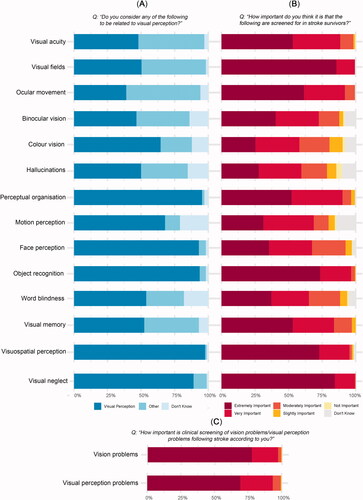
Figure 4. (A, B) Definitions and importance of sensory visual and visual perception domains, as rated by orthoptists. Response rates for all items herein fall between 95 and 100% (n = 38–40).
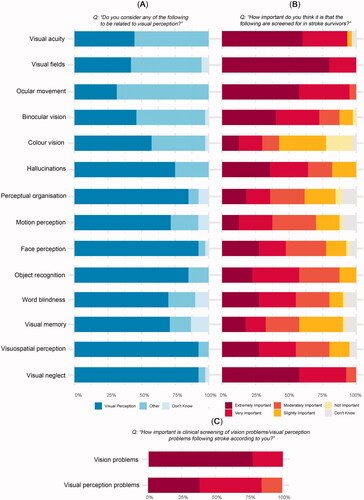
Figure 5. (A, B) Rate of screening and average length of screening window across stroke services. Respondent data from clinicians working hyperacute/acute or community rehabilitation/ESD exclusively were analysed herein. Response rate was 89–99% per item. Respondents unable to provide answer was 1–8 per item.
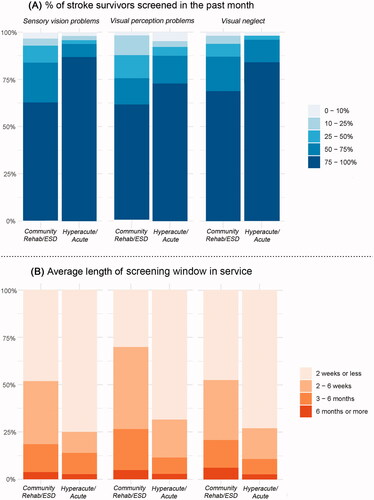
Table 3. Clinicians involved in clinical screening of sensory vision and visual perception difficulties.
Figure 6. Frequency of use and importance of information sources used by respondents to inform visual perception screening. Response rates for all items was 100% (n = 214). *A distinction between visual perception tests and screening tools was made within the survey, referring to “screening tools” as “Set of shorter tests and questions to screen for a range of functions in a short time, usually less than 20 min. This might then prompt follow-up by more in-depth assessment of specific functions and/or by a referral to specialist service.”
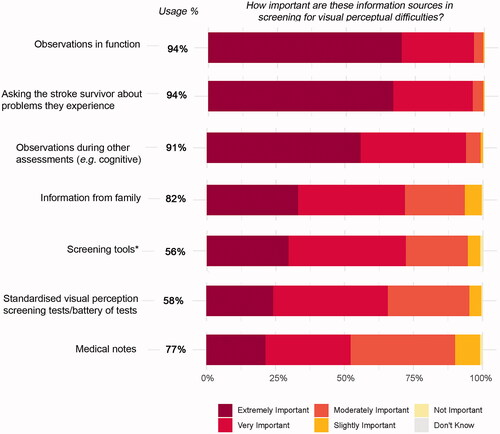
Table 4. Standardised clinical tests used in screening of visual perception difficulties.
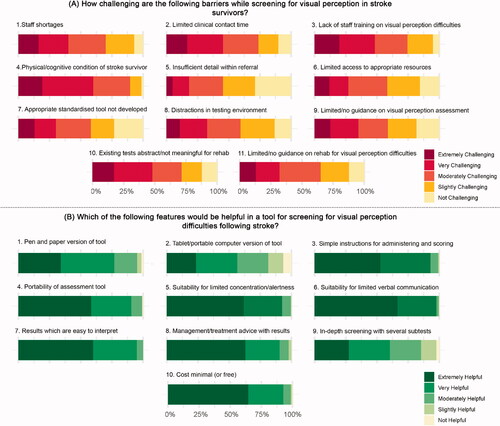
Figure 7. (A, B) Current challenges and facilitators to screening of visual perception problems following stroke. Response rates for all items ranged from 97 to 99% (n = 207–212).
Supplementary_Materials_-_Survey__19052021_.pdf
Download PDF (391.6 KB)APPENDICES__Updated_150721_.docx
Download MS Word (22.4 KB)Data availability statement
Data will be made publicly available on Figshare upon publication of the study. Reviewers can consult the data at the following webpages: