
Figures & data
Table 1. Sample characteristics (n = 78).
Figure 1. Distribution of the severity scores on the Impaired Self-Awareness (ISA) scale and the Denial of Disability (DD) scale.
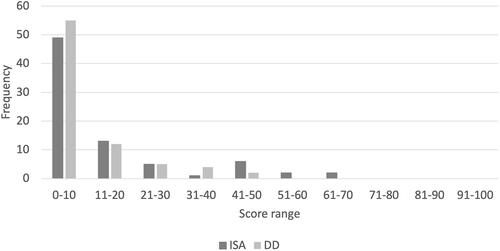
Table 2. Relationships between the ISA and DD scales and other measures.
Supplemental material