
Figures & data
Figure 1. Flowchart of patients in the study.
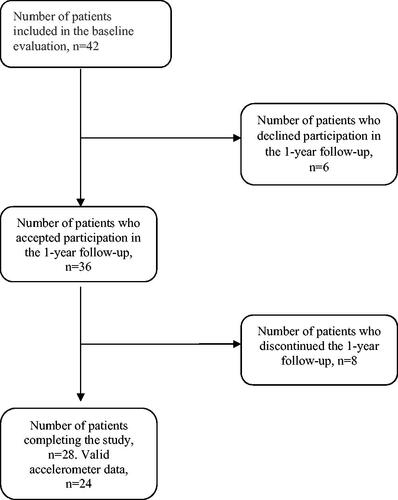
Table 1. Demographic data on the study population.
Table 2. Number of patients fulfilling the recommendations for level of physical activity, n = 24.
Figure 2. Individual differences regarding minutes per week in vigorous physical activity (VPA) and moderate and vigorous physical activity (MVPA) between baseline and follow-up. Positive numbers indicate an increase during follow-up compared to baseline. *MVPA is calculated using MPA + 2*VPA.
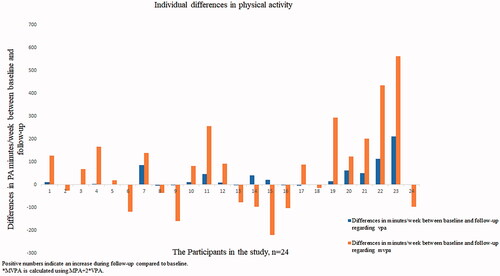
Table 3. Level of physical activity, self-efficacy and health-related quality of life at baseline and 1-year follow-up.
Table 4. Correlations between moderate and vigorous physical activity (MVPA), vigorous physical activity (VPA), self-efficacy and health-related quality of life (HRQoL) at baseline, and accelerator-measured level of MVPA and VPA at follow-up.