
Figures & data
Figure 1. Distribution of self-reported physical function T-score for the sample. Mean (SD) = 30.8 (6.5). Mean (SD) T-score for physical function for the general U.S. population = 50 (10). Higher T-scores indicate better physical function.
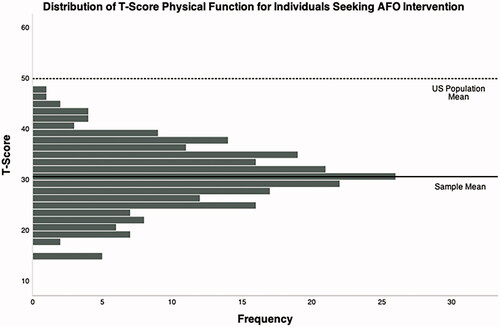
Table 1. Respondent demographics.
Table 2. Respondent device and fall history.
Table 3. Regression analysis summary for patient-reported variables predicting physical function.