
Figures & data
Table 1. Background characteristics for patients with complete responses on the EQ-5D descriptive system at the six-month follow-up after unilateral lower limb amputation, by subsample.
Table 2. Self-reported health outcomes at six-month follow-up after unilateral lower limb amputation, by subsample.
Figure 1. Distribution of responses on the EQ-5D dimensions at six-month follow-up after a unilateral amputation, among EQ-5D-3L (3L) respondents (n = 425) and EQ-5D-5L (5L) respondents (n = 260).
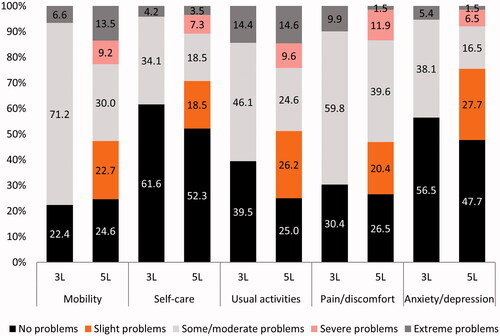
Table 3. Informativity, as assessed by Shannon’s indices, by EQ-5D version.
Table 4. Spearman’s rank correlation coefficients (rho) between responses to the EQ-5D versions (sum score, dimensions, and EQ VAS [5L]), and LCI-5, prosthetic use score, residual limb pain, phantom limb pain, and overall situation as an amputee.
Table 5. Mean EQ-5D index values, t-statistics, and relative efficiency of EQ-5D-3L and EQ-5D-5L, by known groups (amputation level and underlying diagnosis).
Supplemental Material
Download MS Word (60.7 KB)Data availability statement
Access to data is restricted by Swedish law. General information about obtaining access to data is available from the corresponding author Olivia Ernstsson upon request.